
Quick answer: When it comes to AI Overview Traffic Loss, there is no fixed number. Any article telling you there is one, is averaging query types that are entirely different. Informational and definitional queries lose more from having an AI Overview; while comparison, evaluation, and branded queries lose much less. Your expected loss will depend on how many visitors your website gets from each bucket. This can be calculated from your Search Console in about an hour.
Any marketing department looking for an answer here needs a single number to show their executives. But what they usually receive is a headline percentage from a study that didn’t even measure what they need.
The reason behind the vast differences between the numbers is that they are averaging across query types that have nothing to do with each other. A study heavily skewed towards informational consumer queries provides an alarming number. Meanwhile, a study skewed towards commercial B2B queries gives a moderate one. Basically, neither tells you what to expect from your site.
The useful version of this question is not “how much do AI Overviews cost on average.” It is “how much of my traffic sits in the query types that get absorbed, and what should I expect for those specifically.”
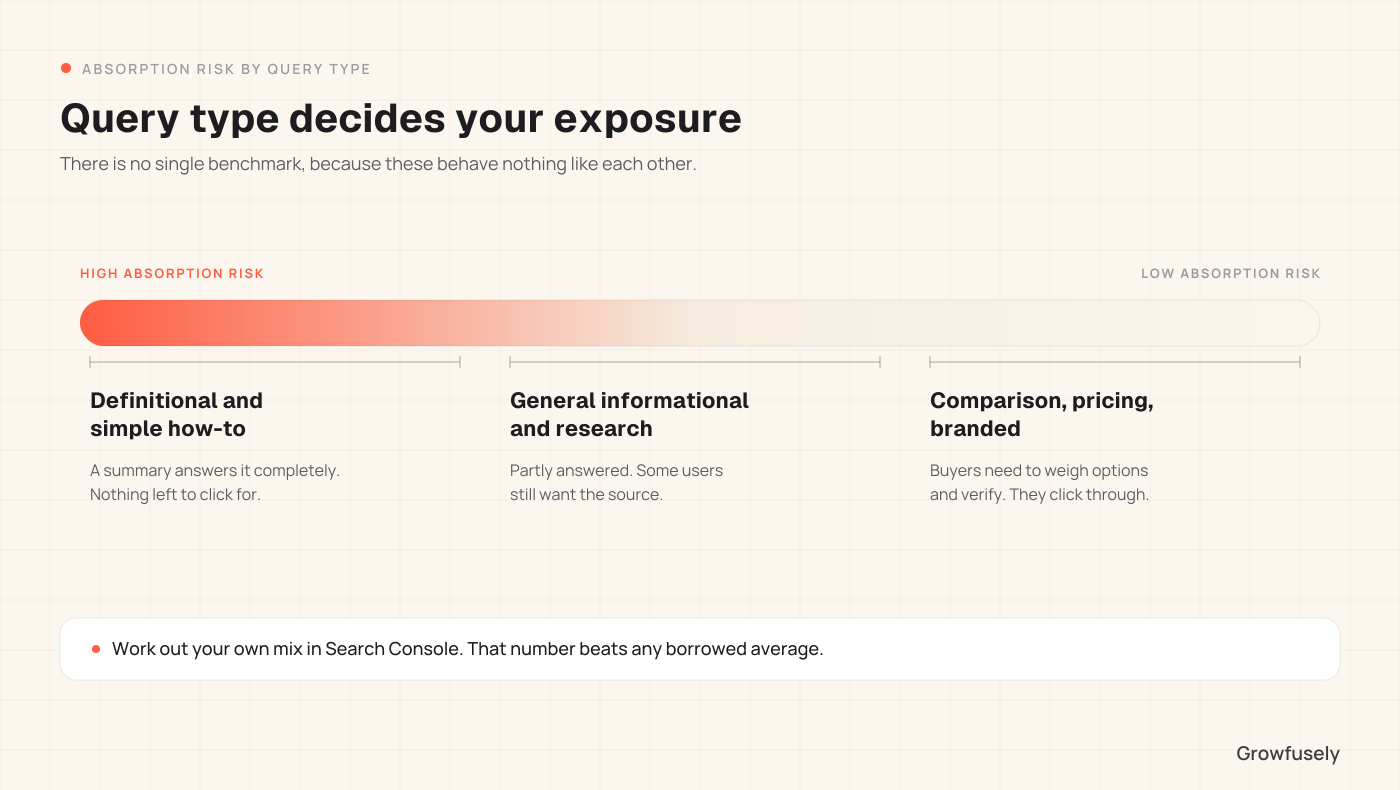
Why Query Type Decides Almost Everything
For an AI Overview, there is no need to click through since the answer to the query is fully provided by the summary. This is true for certain types of queries and not true for others. Let’s learn more about this.
Queries That Get Absorbed Heavily
These include definition queries, basic instructions, fact-checking, and explanations. Once a user finds out the definition of a certain term, the job is done. Think about this: What can your page offer apart from what the summary has already delivered?
Queries That Resist Absorption
These include comparative and evaluative questions, product research, and pricing questions. When a summary provides a conclusion about three particular tools as the best options in their category, it does not help the user in making a purchasing decision. The user still will have to find the sources and verify them. According to our own citation study, a lot of content was cited for comparative questions and vendor comparisons. This reflects the same underlying reality: these queries need sources, not just answers.
Queries Barely Affected
This refers to branded and navigational search type queries. Someone searching your product name wants your site, and a summary does not change that. This explains why an averaged benchmark has almost no value at all. Two SaaS companies that have equal traffic volumes could end up with two totally different levels of exposure because their organic traffic sources may be different.
Calculate Your Own Exposure
An hour spent in Search Console will provide you with something that beats any benchmark hands down. Here’s how it can be done.
Step 1: Export your top queries by clicks. The queries should be enough to cover the majority of your organic traffic, typically 100-200 queries will do.
Step 2: Sort each query into buckets. This will include informational/definitional, comparative and evaluative, brand and navigational queries. Don’t waste too much time trying to define some queries. Proportions matter more than precise classification.
Step 3: Calculate the total clicks in each bucket. Now you know your percentage of traffic that falls into high exposure, resistant and safe buckets.
Step 4: See what has already happened. Compare data from the past six months with the six months prior to those for your informational queries only. Find out if there was any decrease in clicks with an increase in impressions, and by how much percent. This measured change on your site is your real number.
Step 5: Look for mentions of you beyond Google. Feed your top ten purchase intent queries into ChatGPT and Perplexity, and see if you’re included along with the sources are cited. Traffic that migrated to assistants never shows in Search Console at all, so this is the only way to see that portion.
What you end up with is a real exposure profile: this share of our traffic is in the absorbable bucket, it has already moved this much, and here is our current presence in the answers that replaced it.
What the Answers Are Actually Made Of
If a portion of your traffic has already moved to AI answers, the question to ask should be: how do you ensure that you have a presence in these answers?
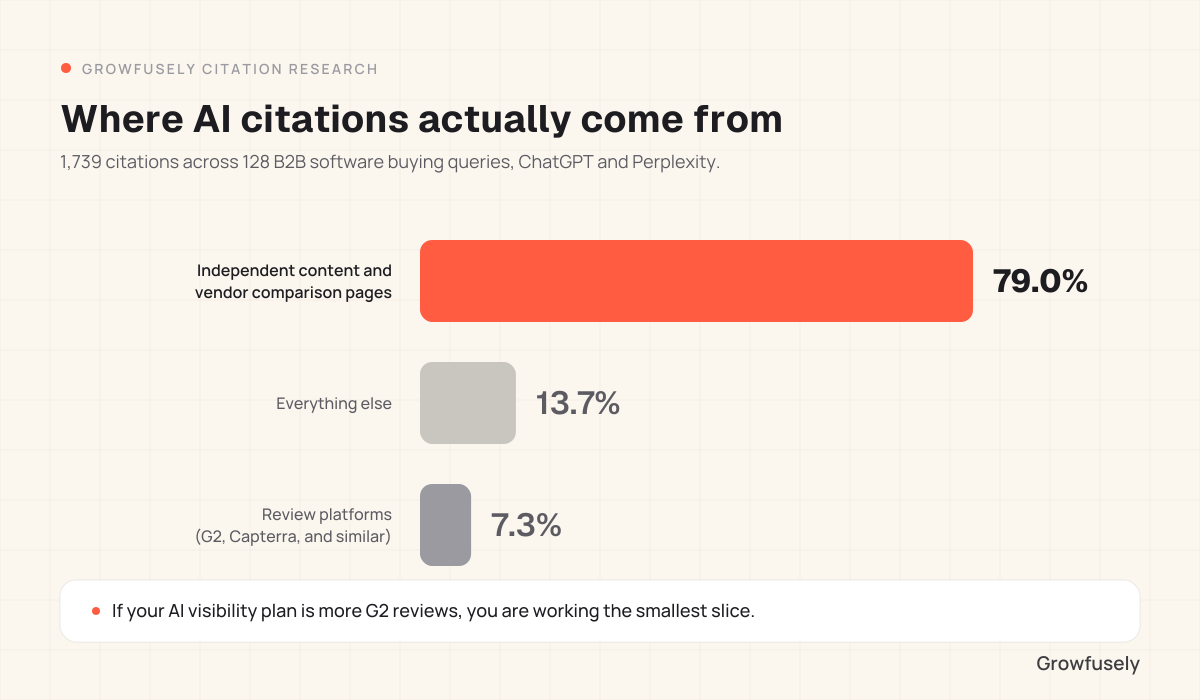
In our analysis, we covered 1,739 citations found in 128 real B2B software purchase queries on ChatGPT and Perplexity, logging every source each engine cited.
We found that independent content and vendor comparative pages were responsible for around 79% of all citations. Review sites, where most AI visibility advice suggests putting your effort into, only made 7.3%. In addition, the engines differed significantly in terms of citation sources for identical queries. Therefore, there’s no way of optimizing your answer layer anymore.
What it comes down to for a team struggling with informational traffic drop is this: you don’t need to improve the quality of absorbed pages, but establish a presence in citation sources.
Setting a Realistic Expectation with Your Leadership
Here are three things to emphasize.
1. Not all of this traffic is coming back as clicks.
Queries which can be answered by the summary will continue to be answered that way. Building a recovery plan around returning those sessions to their previous level sets everyone for an even worse quarter.
2. Sessions are not equal to pipeline.
Map the traffic you’ve lost to the pages which contribute to the pipeline. A steep fall-off focused on top-of-funnel information queries, where comparison and evaluation pages hold steady, is a much smaller issue for the business than it might look from the traffic graph. Check that before deciding how alarmed to be.
3. You need more metrics.
If you only track organic sessions, even the work done successfully in the answer layer can look like it failed. Citation share, measured by how often your brand comes up in answers for your top queries on each engine, is the metric which tracks it. It might be hard to track at first, but it is the most valuable visibility metric most teams have.
What to Do with the Exposure Profile
Once you have the exposure profile, here’s what you do next.
High Exposure, Mostly Informational Traffic
Your priority is building citable assets: original data, honest comparisons, specific practitioner content. Generic explanations of established topics are the most absorbable content there is, so publishing more of them deepens the problem rather than solving it.
Moderate Exposure, Mixed Traffic
Protect and expand the comparison and evaluation content that still converts, and treat informational content as a citation play rather than a traffic play. The bar for depth goes up, because only distinctive content earns citations.
Low Exposure, Mostly Branded and Commercial Traffic
You have time. Use it on entity clarity and citation presence before the exposure grows, rather than after.
In all three cases the underlying work is the same: be the source that answers are built from, and make sure engines can recognize you as a distinct entity when they build them.
Where to Start
If you want the exposure profile without spending the week building it yourself, you can rely on us. That is the work we do: classifying your traffic by absorption risk, measuring what already moved, checking your citation presence across engines, and mapping what to build next.
Book a discovery call and we’ll run it for your categories.
Frequently Asked Questions
Is there a benchmark number I can quote?
Published research cites wildly varying figures since these are based on differing sets of queries. Instead of citing an average calculated by someone else, compute it yourself from your Search Console data using the steps mentioned above. This number can be defended in a way that a borrowed benchmark cannot.
Do AI Overviews appear for every query?
No. The likelihood of AI Overviews appearing increases in informational queries and decreases in commercial/transactional queries. Also, their presence varies over time as Google tweaks things. This is yet another reason why a static benchmark quickly gets outdated.
If informational traffic is being absorbed, should we stop publishing it?
No, you shouldn’t. However, the function of such content shifts. It is no longer about traffic, but about citations and authority. Further, the originality quotient rises considerably. A mere informational article will no longer earn either clicks or citations, while an article with original data/analysis will still be able to do so.
How do we measure citation share?
Create a list of prompts your customers would actually use, test those on each search engine at regular intervals, and see if your brand shows up and what sources are being cited. Begin manually with a small number of prompts. The trend, and not the number, is what counts.
Does traffic loss from AI Overviews mean our SEO is failing?
It does not. If your ranking and impressions remained stable, then you know your SEO campaign is working and the click behavior changed underneath it. The failure mode to watch for is continuing to measure only the part that moved.

Pratik Dholakiya is the Founder of Growfusely, a SaaS SEO and AI Search Visibility agency.
