
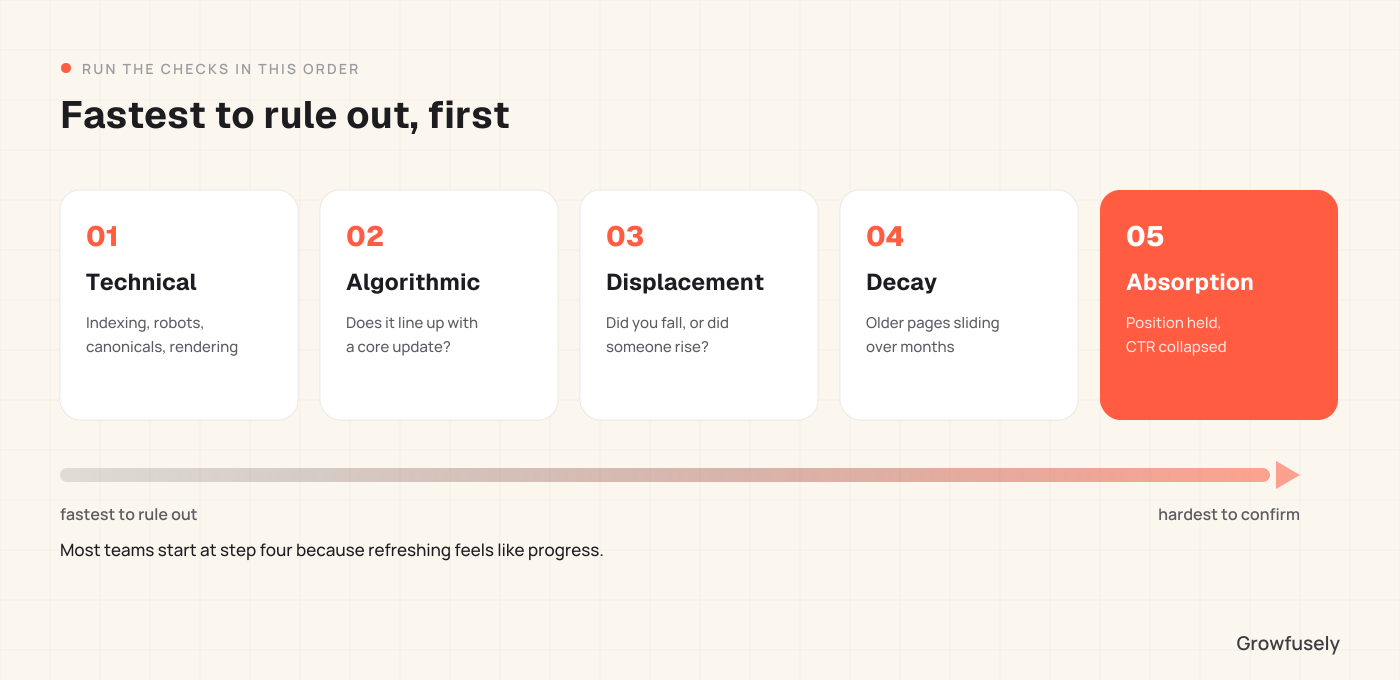
Quick answer: The top five causes of decline in organic traffic are: technical breakage, algorithmic devaluation, competitive displacement, content decay, and answer absorption by AI. They look similar in a traffic analysis chart, but need completely different fixes. So, make sure you identify the issue accurately before you take corrective action. This post will run the checks in order, from the fastest to rule out to the hardest.
What’s the first thing you do as soon as you notice drops in your website traffic? Refresh your existing posts, audit the technical setup, build some links, publish more, and so on? You may think of it as progress, and sometimes it works by accident.
The actual problem? There could be multiple reasons which lead to the same graph, and the solution to one won’t help you with the rest. Teams might routinely refresh content for a quarter when the actual cause was a template change that broke internal linking, or rebuild their technical setup when the cause was a competitor publishing something better.
So, how do you know what’s actually going on? This step-by-step guide will help you discount the real reasons in an order that saves the most time: quickest to confirm or rule out first.
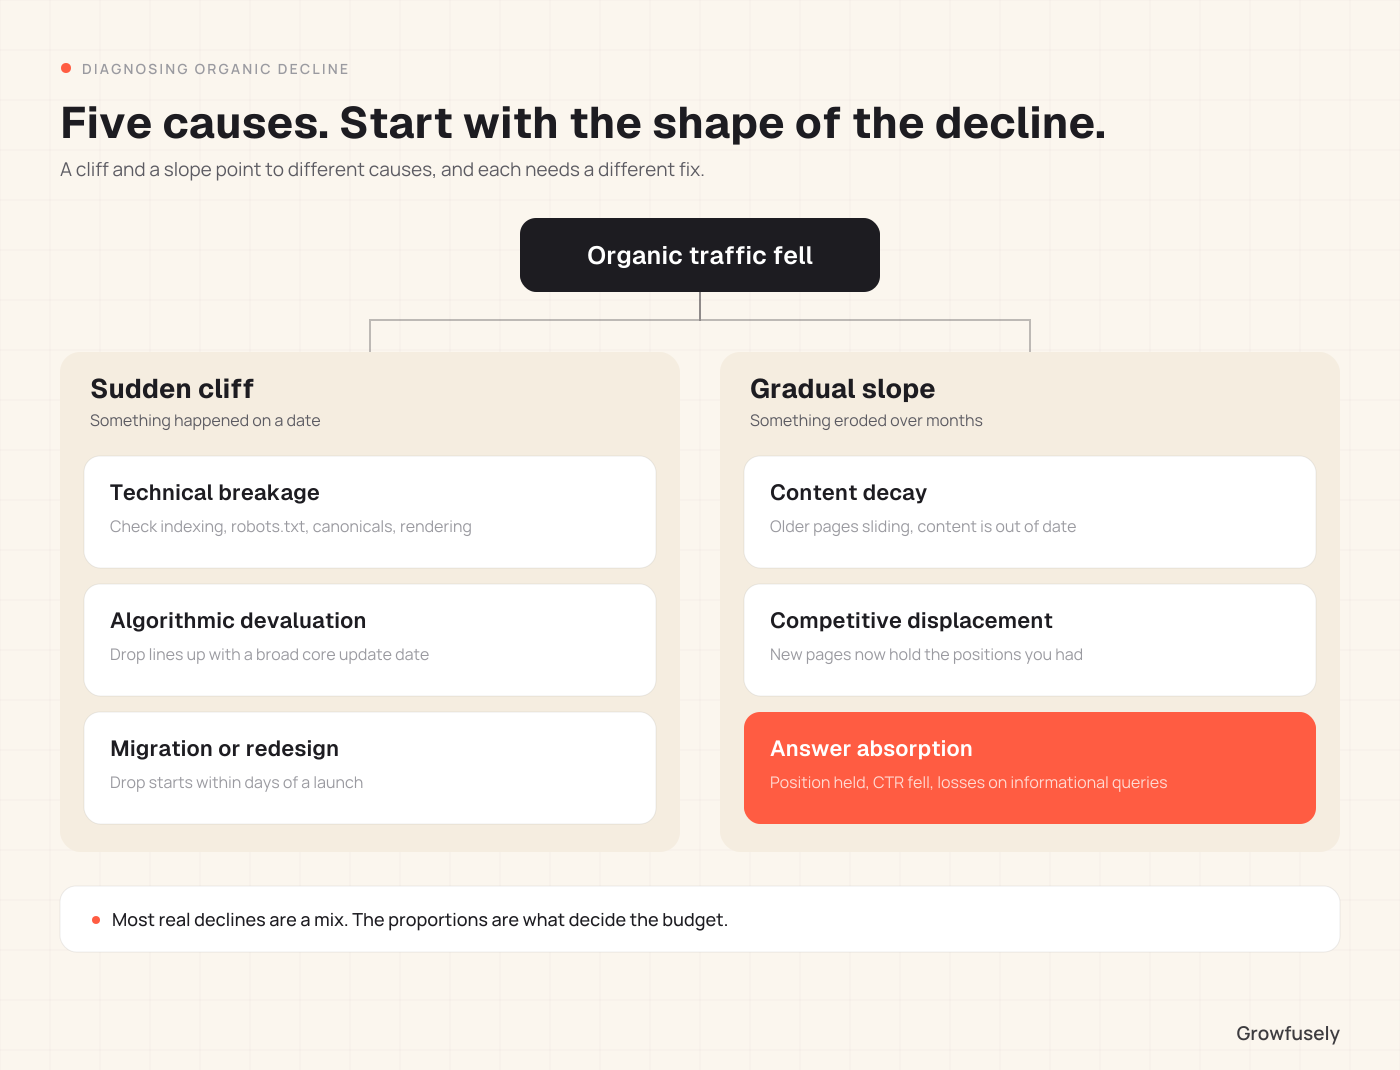
Before You Start: Get the Shape of the Decline
Start by proving these two things to narrow the possibilities immediately.
1. When did it start?
In Search Console, look at the data from the last year and pinpoint the inflection point. A cliff (sudden drop within a few days) is indicative of an event: a technical issue, a migration, an algorithm change, or manual action. A slope (slow drop over months) indicates decay or displacement. Just this one question narrows your investigation space significantly.
2. Is it everything or something?
Narrow by page and query. A sitewide drop indicates technical or algorithm reasons. A drop limited to particular pages or a particular type of content indicates decay, displacement, or absorption. Be sure to take note of what pages retained traffic, as this will indicate which pages were lost.
Write both answers down before continuing. All of the checks mentioned below depend on them.
Check 1: Technical Breakage
Rule this out first.
It is the fastest to check, the most common cause of sudden drops, and the easiest to fix.
What to look at:
- Coverage and indexing reports: Are pages that used to be indexed now excluded? Look specifically for noindex tags applied by accident. This is the single most common self-inflicted traffic disaster.
- Robots.txt: A staging rule that accidentally made it to production blocks everything, and is easy to overlook.
- Canonical tags: When canonical tags point to a page with incorrect URL, the page simply drops out of search results.
- Redirect chains and broken internal links: These are especially common in case of a redesign or a URL change.
- Rendering: If your website depends on JavaScript rendering of content, make sure this content actually gets rendered into HTML. SaaS websites tend to fail here because app-related pages usually use the same technology stack as an application itself.
- Page experience regressions: A change in the design that caused performance problems or layout issues on mobile can occur weeks after it was rolled out.
If the drop was sudden and correlates with a release date, you’ve most likely found the cause. Make changes and monitor for four to six weeks.
Check 2: Algorithmic Devaluation
Compare the time of your inflection point with those of known updates.
If the drop begins close to the date of a major core update, then that’s the probable cause.
What’s important about this is that core updates are not penalties. There’s nothing broken and nothing that you can simply turn off. The system has evaluated the quality of the results and yours came out as relatively worse. You’ll need an actual improvement on what you site offers, rather than just a technical fix.
Signs supporting this are: the drop isn’t targeted to specific pages, other sites in your niche have also shifted around that time, and the pages that dropped most are the thinnest or the least specialized pages in your portfolio.
All in all, recovery from a core update takes time, sometimes more than one or two following updates. Also, it entails significant work in terms of better content, greater specialization, and stronger topical focus. If someone promises a quick fix after a core update loss, they’re lying.
Check 3: Competitive Displacement
Determine whether you have fallen, or a competitor has risen.
These two situations appear similar in your chart but are entirely different issues.
Review the top ten losing searches for your site and examine the current rankings. If new pages rank where you once did, see how they managed to do it through greater depth, more structure, original data, new information, or a format that matches the search better.
You can confirm the diagnosis when you have dropped by a couple of spots on certain searches, even though all of your indexing and site health looks good. The solution requires being competitive, not corrective, and beating your competitors to be the better choice.
Check 4: Content Decay
Search for the slope effect on older content.
Decay takes place slowly, on older content, and can be difficult to spot from month to month but becomes evident once you start comparing over a year period.
The signs of decay include:
- Pages published eighteen months or more ago losing steadily
- Content with dates, statistics, tool lists, or version references that are now out of date
- Queries where user expectations shifted while your page stayed the same
Decay is the most recoverable cause on this list, and refreshing genuinely works when decay is the actual problem. That is precisely why it gets misapplied: the fix is satisfying, so teams reach for it regardless of the diagnosis.
Check 5: Answer Absorption
This is the check most teams skip, and increasingly it is the answer.
The pattern: Impressions flat or growing, position flat, CTRs down. Everything is working and nothing was demoted. Your search query was answered before reaching you, either in an AI Overview or through an alternative assistant the user used instead of searching.
Here are the two ways to confirm:
1. In Search Console
Filter to your queries with biggest CTRs losses and check their average position during the same time frame. Position remains the same, CTR dropped, and the losses come mainly from informational and definition queries: this is the absorption.
2. Outside Google
Test your ten key purchase queries in ChatGPT and Perplexity, and note if your brand is present in the answer, along with the sources that were used by each engine. Any traffic that abandoned your Search Console will not appear as a loss, but as non-existing data. This is the only way to identify it.
We measured where those answers come from: across 1,739 citations from 128 real B2B software buying queries, independent content and vendors’ own comparison pages drove roughly 79% of citations, while review platforms accounted for 7.3%. If your traffic went into AI answers, presence in those source types is the route back to visibility, though often as citations and brand awareness rather than as organic sessions.
We cover this pattern in detail in impressions up, clicks down.
Putting the Diagnosis Together
Usually, declines are a combination of several kinds. The typical B2B SaaS experience would entail this: some technical debt incurred through a redesign, decay in older informational posts, and absorption on definitional queries.
This is all fine. The only thing that matters is the proportion of each, because the proportions determine the budget. Seventy percent absorption of informational traffic will not return when refreshed with forty posts, and that money needs to go somewhere else. If seventy percent is decay in commercial pages, refreshing is precisely what it takes.
Two questions to ask yourself before spending anything:
1. Which pages that lost traffic actually generated any pipeline?
Sessions and revenue are different things. A decline in top-of-funnel posts but no change in evaluation pages is a lesser business issue than the numbers suggest. Look at the pipeline to gauge your concern.
2. Which part of the loss is recoverable in the form it was lost?
Technical, decay, and displacement losses usually come back as clicks. Absorption losses usually do not, and pursuing them as clicks wastes a quarter.
Where to Start
Running this diagnosis yourself takes a few hours and will tell you a lot. But there is one thing it won’t tell you – that’s the ratio. The share of the loss in each category and consequently how to allocate budget.
That is the part we do. We map when the decline started, classify it by cause, check your citation presence across AI engines, and hand you a prioritized plan with honest expectations about what each fix can return.
Book a discovery call and we’ll scope it for your site.
Frequently Asked Questions
How long should I wait before acting on a traffic drop?
We suggest waiting two to three weeks for any apparent cliff, as the reporting lag and short-term volatility will smooth out during that time. You may act on it right away, but do not make big decisions based on a few days of data.
Can I have more than one cause at once?
Pretty much always. Conduct all the tests even after finding something conclusive, as the first cause found is never the only cause.
What if the technical checks come back clean and there was no algorithm update?
Then you are dealing with either displacement, decay, or absorption. Segment your data by page age and query type: decay – old pages, displacement – specific queries with competing websites, absorption – good positions with low CTR.
Does a traffic drop always mean a revenue drop?
No, and this mistake will result in bad choices down the lane. Identify the traffic lost by mapping it on pages that build the pipeline. Losses in informational sessions have less impact than losses in comparison page visits.
Should I disavow links if traffic dropped?
Not recommended. Disavowal is applicable to cases of manual action and really harmful links. It will do much more harm than good because of the above-mentioned five reasons.

Pratik Dholakiya is the Founder of Growfusely, a SaaS SEO and AI Search Visibility agency.
