The SaaS market has grown by over 15% in 2021 and it’s likely to register a CAGR of 27.5% for the period of 2021 to 2028.
Moreover, the top 10 SaaS companies have crossed a combined market capitalization of a whopping $800 billion.
With this exponential growth, SaaS businesses are also evolving and upgrading their marketing strategies.
Owing to technological advancements you can measure nearly every aspect of your SaaS business. But the more access we have to the data, the more it adds to the ambiguity as to what to track.
This is where prioritizing the most relevant and important SaaS marketing metrics and KPIs helps.
In this article, we’ll discuss:
- What are SaaS KPIs and metrics,
- Why should you track them, and
- The 21 SaaS metrics and KPIs you must track
Let’s dive right in.
What are SaaS Marketing Metrics and KPIs?
Since there’s a lot of confusion about KPIs and Metrics, first, let’s clear the air around it and understand what both the terms mean.
Saas Metrics
In simple terms, SaaS metrics refer to the quantifiable data that is directly or indirectly associated with business performance. These data points provide a context behind the success or failure in achieving the desired results.
Technically, anything that you can measure can be considered a business metric. So it’s easy to get caught up in trying to track and improve numerous metrics.
However, as a SaaS company, you must prioritize tracking the metrics that directly impact the broader bottom-line goals such as revenue, profits, and margins.
SaaS KPIs
Key Performance Indicator (KPI) on the other hand, is a metric that contributes to specific business goals. That’s the reason KPIs are usually laser-focused on particular targets and objectives.
For example, achieving a 10% net profit margin is a KPI. Here the target of 10% serves as a benchmark and it’s aligned with the bottom line.
That said, the main difference between metrics and KPIs is that a metric can exist without a target around it, but KPIs can’t. Moreover, you can attach a target to most metrics and convert them into KPIs.
Nevertheless, every KPI is a metric but every metric can’t be a KPI.
Why is it Important to Track the SaaS KPIs and Metrics?
SaaS businesses function differently than other online businesses since most of their revenues come either from monthly subscriptions or annual contracts.
Unlike eCommerce businesses, SaaS companies have a longer customer acquisition cycle which may take a few weeks or even months to complete. Also, most SaaS businesses acquire customers using an inbound — also called organic — method with a robust content marketing strategy.
While organic growth may take some time, you still need to keep investing resources in customer acquisition.
So tracking the key SaaS metrics and KPIs can help you strategize for long-term growth and stay on top of your costs and revenues. This way, you can also fine-tune your overall business strategy.
Key SaaS Marketing Metrics and KPIs to Track
Now that you know what are SaaS KPIs, metrics, and the importance of tracking them, let’s discuss the 21 key metrics and KPIs (in no particular order) you must track as a SaaS business owner.
1. Active Users
Active users refer to the number of people that engage with your SaaS product on a daily basis. Here, engagement means logging into or using the SaaS app.
It’s a basic sanity check of your SaaS customer base. A higher ratio indicates that users enjoy using your product or find value in it or both.
The most common active user metrics are Daily Active Users (DAU), Weekly Active Users (WAU), and Monthly Active Users (MAU).
However, the DAU/MAU — also known as the Stickiness ratio — makes better sense of these metrics.
For instance, 1000 people use your product monthly and 300 of them use it daily. So, your DAU/MAU ratio is 30%.
Although there’s no standard benchmark for a good or bad stickiness ratio, the higher the better.
2. Monthly Recurring Revenue (MRR)
Monthly Recurring Revenue (MRR) is the earnings that you receive from users every month.
Since most SaaS businesses generate a major share of the revenue from monthly subscriptions, it’s a crucial metric to track. It provides valuable insights into the growth trajectory of your business.
This is how MRR works:
Let’s say you charge $250 as a monthly subscription for your SaaS product. You have two paying customers in January and February, and then a third customer was added in March.
Hence, the MRR would be:
- January: $250 + $250 = $500
- February: $250 + $250 = $500
- March: $250 + $250 + $250 = 750, and so on
Thus, MRR only accounts for your revenue from monthly subscriptions. So it’s different from total business revenue. For instance, if you also offer non-recurring paid services like set-up or consulting, you don’t have to include it in MRR.
The purpose of MRR is to give you a fair idea of predictable monthly revenue that usually comes from subscriptions.
3. Annual Recurring Revenue (ARR)
Calculating Annual Recurring Revenue (ARR) is pretty straightforward. You just need to multiply MRR by 12.
Thus, ARR = MRR*12
So ARR gives you an overview of your yearly revenue. If you’re an enterprise SaaS company focusing on annual contracts, ARR would make more sense for forecasting purposes.
4. Average Revenue Per Account (ARPA)
ARPA is an average revenue that comes from each of your customers or users. It’s also referred to as Average Revenue Per User (ARPU).
You can calculate this metric for a month or a year. Here’s how:
This is a useful metric to understand the pricing choices of your SaaS customers. Especially if you have multiple subscription plans for individual users, agencies, and enterprises.
In such cases, consider calculating the monthly ARPA for new users that subscribed in the last month. This would give you the recent pricing trendline for your business.
At the same time, if you want to convert this metric for yearly trend projection, just replace MRR with Annual Recurring Revenue (ARR).
This would also give you valuable insights into the plan upgrade opportunities within low-ticket size user groups.
5. Customer Acquisition Cost (CAC)
Customer Acquisition Cost (CAC) — also known as Cost Per Acquisition (CPA) — is how much you spend to acquire a new customer. These acquisition costs include all the marketing and sales-related expenses.
A simple way to calculate CAC is by adding up all the marketing and sales costs for a given time and dividing it by the number of customers acquired in that duration.
For example, your sales and marketing spend for January was $6000 and $8000 respectively.
And you could add 10 new clients in the same month.
Thus,
Similarly, you can derive your annual CAC by dividing the yearly sales and marketing costs by total new customers acquired in a year.
6. CAC Payback Period
CAC payback is the number of months it takes to outearn the amount spent on customer acquisition. Sometimes it’s also referred to as Time to Recover CAC.
This metric helps you understand the capital efficiency of your SaaS business. In other words, it indicates the amount of capital investment needed before you start making profits.
Thus, the shorter the payback period, the sooner your business starts earning profits.
Let’s say your CAC is $1000 and your MRR per customer is $100. So the CAC payback for your business = $1000/$100 = 10 months.
This means a customer is profitable if you can retain them for more than 10 months and beyond.
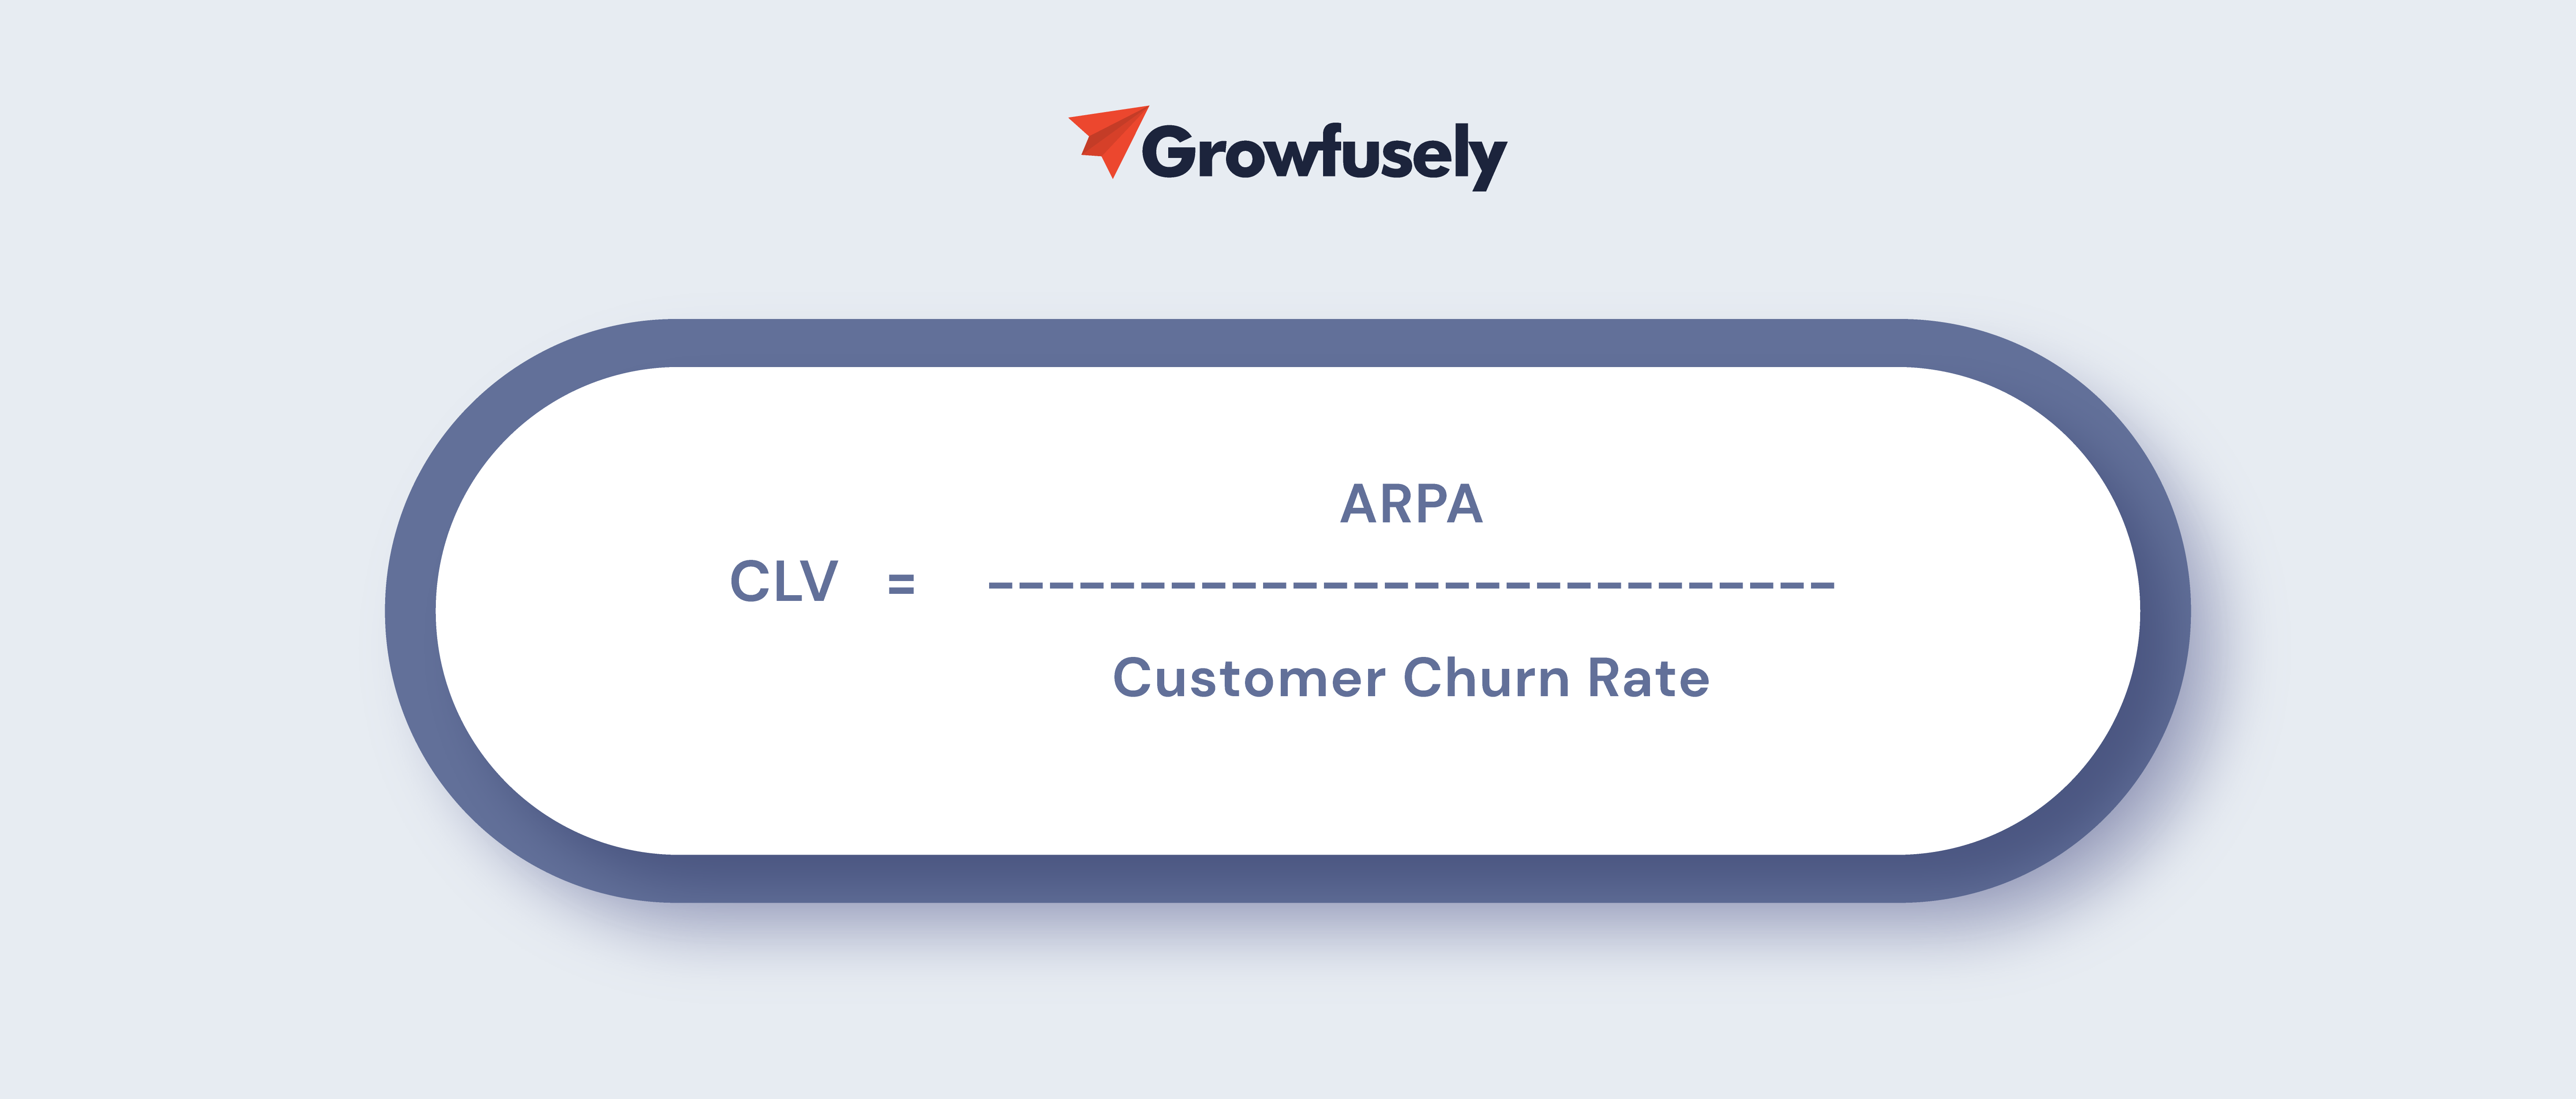
7. Customer Lifetime Value (CLV)
From the time a customer starts a paid subscription to your SaaS product and until they opt-out (hopefully never!), the total revenue generated from each user is referred to as Customer Lifetime Value (CLV).
This SaaS marketing metric tells you how much, and for how long a customer contributes to your revenue stream.
Here’s the formula for CLV:
Taking a hypothetical example, with an ARPA of $300 and a 15% customer churn rate, CLV for your SaaS company would stand at $2000.
8. CLV : CAC Ratio
Customer Acquisition Cost (CAC) and Customer Lifetime Value (CLV) hardly make any sense when they’re measured in isolation. But when you measure your CLV up against the CAC, it gives you a better idea about profitability.
For instance, your CLV is $5000 and your CAC is $2500.
So the ratio looks like: $5000 : $2500 = 2:1.
As a rule of thumb, your CLV should always be greater than CAC. It means the amount you’re spending on customer acquisition is generating profits.
Ideally, the CLV for your SaaS organization should be at least three times the CAC. And some of the top SaaS players like Salesforce and Constant Contact have a CLV to CAC ratio of nearly 5x.
9. Customer Churn
Customer Churn Rate is the percentage of users that either canceled or didn’t renew their subscription during the observation period — say a month, quarter, or year.
It’s a crucial metric for SaaS businesses as a higher churn rate has a direct negative effect on revenue and profitability. At the same time, it also warrants an investigation into the factors causing higher customer churn.
The Customer Churn Rate formula is:
So if you had 200 customers at the beginning and lost 10 customers towards the end of time duration, your churn rate would be:
So what’s the acceptable churn rate?
If the above figure of 5% is the annual churn rate, you don’t need to worry much as long as you’re acquiring new customers consistently. As experts suggest, a 5% to 7% churn rate is acceptable in the SaaS space.
However, if it’s a 5% monthly churn, then it’s a challenge you need to address on priority.
10. Revenue Churn
Wondering why you need to track revenue churn when you’re already tracking the customer churn rate?
It’s because measuring the customer churn rate standalone can be a little deceptive sometimes.
For example, you have 100 basic plan users each paying you $200 a month and 100 premium users with $1000 a month. Thus, your total monthly revenue stands at $120,000.
Now if we take the above example of a 5% customer churn rate, of the total 200 monthly users 10 will be churned.
If all these 10 churned customers are basic plan users, you’ll lose $2000 from your MRR. However, if all of them are premium users, then you end up losing $10,000 a month.
Now let’s see its impact on the revenue churn rate in both cases.
So in the first case:
And for the second case:
Thus, it has a major impact on the revenue in the second case scenario. However, this was for illustration purposes only. Usually, revenue churn would come from multiple user categories.
11. MRR Growth Rate
As the name suggests MRR Growth Rate shows you how your MRR is growing month over month. It’s an important growth metric for SaaS companies as it indicates the speed of the growth.
However, this metric can be somewhat misleading when we compare the MRR growth rate of a SaaS startup against a well-established business.
For instance, a SaaS startup has 10 paid users by the end of this month and they acquired 10 more in the next month. And at $100 per subscription their revenue jumped from $1000 to $2000 within a month. That’s a 100% MRR growth rate.
Now, for a SaaS company having 100,000+ users and $10 million MRR, achieving a 100% MRR growth rate can be a challenge.
So ensure you consider the above factors while calculating this metric.
12. SaaS Quick Ratio
Although there are multiple SaaS marketing metrics that you should be tracking as a business owner, some metrics can give you a quick insight into the growth trajectory. That’s where the SaaS Quick Ratio comes in handy.
And the Quick Ratio formula is:
It highlights how your business is growing by accounting for dynamic factors like:
- New MRR: MRR generated after adding new customers
- Expansion MRR: Additional revenue from existing users (e.g. plan upgrades)
- Contraction MRR: Reduction in revenue from existing customers (e.g. downgrades)
- Revenue Churn: MRR lost due to cancellations
13. Click-Through Rate (CTR)
Click-Through Rate (CTR) is the percentage of people that clicked on:
- A link in search results
- Email links
- Paid ads
- Social media ads
- On-site CTAs, etc.
CTR is calculated by comparing how many times users click on your content in comparison to the impressions (or views) it generates.
CTR tells you whether your content title, email subject, ad copy, CTAs, etc. are appealing to your target audience.
Here are some quick tips to improve CTR and strengthen the SEO of your SaaS website.
- Optimize headline: Create a compelling — and emotionally triggering — headline for your content, landing pages, ad copies, email subject lines, etc.
- Focus on search intent: Understand your audience, their search needs, and their search queries.
- Keyword mapping: Conduct in-depth keyword research and map the keywords according to your users’ buying journey.
- Optimize for Mobile: Since 63% of the Google visits come from mobile devices, ensure your site, landing pages, and ad campaigns are optimized for mobile.
14. Marketing Qualified Lead (MQL)
Marketing Qualified Lead (MQL) is a lead that matches your buyer persona and has shown interest in your product or service.
SaaS MQLs are usually acquired with content strategies such as offering freebies like resources, tools, templates, etc. And if they fit your ideal customer profile, they’re nurtured further to help them navigate through your sales funnel.
And once they’re ready for pitching a sale, they’re passed on to the sales team.
15. Sales Qualified Lead (SQL)
In simple words, Sales Qualified Lead (SQL) is a potential customer or prospect who has expressed increased interest in your SaaS product.
Based on their level of interest and behavior, the marketing team assigns a score to each lead. It’s called lead scoring. This helps the sales team know who is a more qualified lead and where they should invest more time.
As a SaaS business owner, you should also track your MQL to SQL ratio — MQLs that convert to SQL. This would help you highlight the areas where you need to fine-tune your lead nurturing practices.
16. Free Trials and Demo Requests
Most SaaS businesses offer free trials or demos to their prospects or leads. This helps you engage your potential customers and know where exactly they fit into your sales funnel.
You can consider the leads that opt-in for a free trial as MQL as it’s an indication of some interest in your product or service.
On the other hand, some SaaS products can be too complex to offer a free trial on them. So offering a free demo may work better. Here, if a prospect shows commitment to sit through the demo, consider them as a SQL.
17. Lead to Customer Rate
Lead to customer rate is a more specific conversion rate as compared to measuring conversion from the overall website traffic. This SaaS marketing metric highlights the number of leads that are converted into paying customers.
If the lead to customer rate is below your target, then it’s an indication that:
- The lead quality is poor, or
- There’s a gap in lead nurturing, or
- There’s an issue with MQLs or SQLs, or
- Combination of the above factors
18. Abandon Rate
Just like customers abandon shopping carts while purchasing online, SaaS shoppers may also chicken out during the checkout process. So we can say that it’s a sale that didn’t materialize.
Although it’s a popular eCommerce metric, you — the SaaS owner — should also track your checkout abandonment rate. It would not only give you insights into customers’ behavior but you can also convert the abandoned checkouts into sales with an effective abandonment email campaign.
Here’s how you can calculate the abandonment rate:
For example, 100 customers initiated checkout on your website. However, only 25 orders were completed. So your checkout abandonment rate is:
Thus, you can measure your cart abandonment rate. And If you find that your abandonment rate has increased, you can dig into the reasons why customers abandon the checkout process and address the issues accordingly.
19. Net Promoter Score
Net Promoter Score (NPS) helps you know the level of customer or client satisfaction. It’s a simple process where you ask your users:
“On a scale of 0 (not at all) to 10 (definitely), How likely are you to recommend [your SaaS product] to a friend or colleague?”
According to their ratings, you’d sort them into the categories such as detractors, passives, and promoters.
To calculate an accurate NPS, you’d need to subtract the percentage of detractors from promoters, and that’s how you get the net value.
So if there are 60% promoters and 20% detractors, your NPS would be 40%.
A higher NPS means that users are more likely to spread a positive word-of-mouth message about your SaaS product.
20. Average First Response Time
Average First Response Time is a customer service metric. It indicates the time that your support team takes to respond once customers submit their queries.
A study by Site Builder Report revealed that 21% of the SaaS companies replied to customer queries within an hour. On the other hand, 12% of them took more than a day to revert.
Needless to say, your customers don’t like waiting. In fact, none of us do.
So keeping a tab on this metric can help you raise your support standards and thereby customer satisfaction.
21. Average Resolution Time
Average Resolution Time (ART) is the average duration that your support team takes to resolve the open customer queries (or raised tickets) in a given time.
You can measure the ART for different time periods such as weekly, monthly, quarterly, etc.
This duration can vary depending on the type of your SaaS product and the complexity of the customer issues. However, it’s a given that the shorter the time, the better your customer service efficiency.
Moreover, your Customer Relationship Management (CRM) software can also give you detailed reports for individual customer support agents. So if a few agents are taking longer than the standard time, you can counsel and train them to reduce the average.
Track Your Way to SaaS Success
As we wrap up this post, it’s worth mentioning that tracking these KPIs and metrics alone won’t create magic. Because it’s not about having a treasure trove of data, but what you do with the data that makes a difference.
So the first place to start is knowing the most important goals for your SaaS business. Then identify the metrics and KPIs that help you achieve these goals.
Once you get a grip of the key SaaS metrics for your business, you need to track, analyze, and interpret them to evaluate your performance. And if needed, don’t be afraid to change your strategies accordingly.
Image Source – Tomasz Tunguz
Author
Pratik Dholakiya
Pratik Dholakiya is the Founder of Growfusely, a SaaS content marketing agency specializing in content and data-driven SEO.

 About Growfusely
 White LabelMake us your (hidden) helping hand in delivering high-quality work to your SaaS clients.
 TeamCheck out the faces (and their backstories) behind our brand.
 Partner With UsJoin forces with us and earn a recurring monthly commission.
 Careers We're HiringJoin our growing team of passionate content marketing geeks.
 SEO & AI Search VisibilityBoost your search engine rankings with a blend of compelling content and technical tweaks.
 Content Strategy & ProductionFuel your brand awareness and user acquisition with strategic content creation and distribution.
 Authority & CitationsEarn relevant, high-quality backlinks from top websites in and around your niche.
 SaaS InfographicsLearn battle-tested best practices on all things SaaS marketing — visually.
 SaaS InterviewsRead our tête-à-têtes with SaaS marketing experts on achieving content-driven organic growth.