Measuring the return on investment on any organic marketing effort is tricky. In B2B content marketing, it’s even trickier.
You’re pouring time and budget into blog posts, whitepapers, case studies, and webinars. But weeks go by, and you’re still wondering: Is this really worth the effort?
That’s because B2B content doesn’t always have a straight line to revenue. You may get leads, but they may take months to convert. Multiple decision-makers are involved. And half the time, your content gets used by sales reps or shared silently on Slack.
And so, B2B marketers often have a hard time justifying their work’s worth and explaining ROI clearly. With the right lens, though, it’s absolutely measurable.
In this guide, we’ll show you what ROI really means in B2B content, which metrics are worth tracking (and which aren’t), some industry benchmarks to aim for, and proven ways to improve your return over time.
What Is B2B Content Marketing ROI?
ROI is simple in theory: How much did we gain compared to how much we spent?
Because you’re not marketing a $10 t-shirt, you’re marketing complex solutions with long sales cycles. A blog post might bring in a lead today who won’t convert for six months. And when they do, it might’ve taken six other touchpoints to get there.
Sometimes your content pulls leads into the funnel. Sometimes it helps sales close the deal. Sometimes it just builds trust quietly in the background. All of that is impact, which counts.
So, ROI tracking in B2B content marketing is more like a web, not a straight line.
Key Metrics to Measure B2B Content Marketing ROI (And How to Track Them)
To measure real return, you need to look beyond vanity metrics and focus on what drives leads, revenue, and sales efficiency.
Here’s a breakdown of the most important metrics and how to track them inside popular tools.
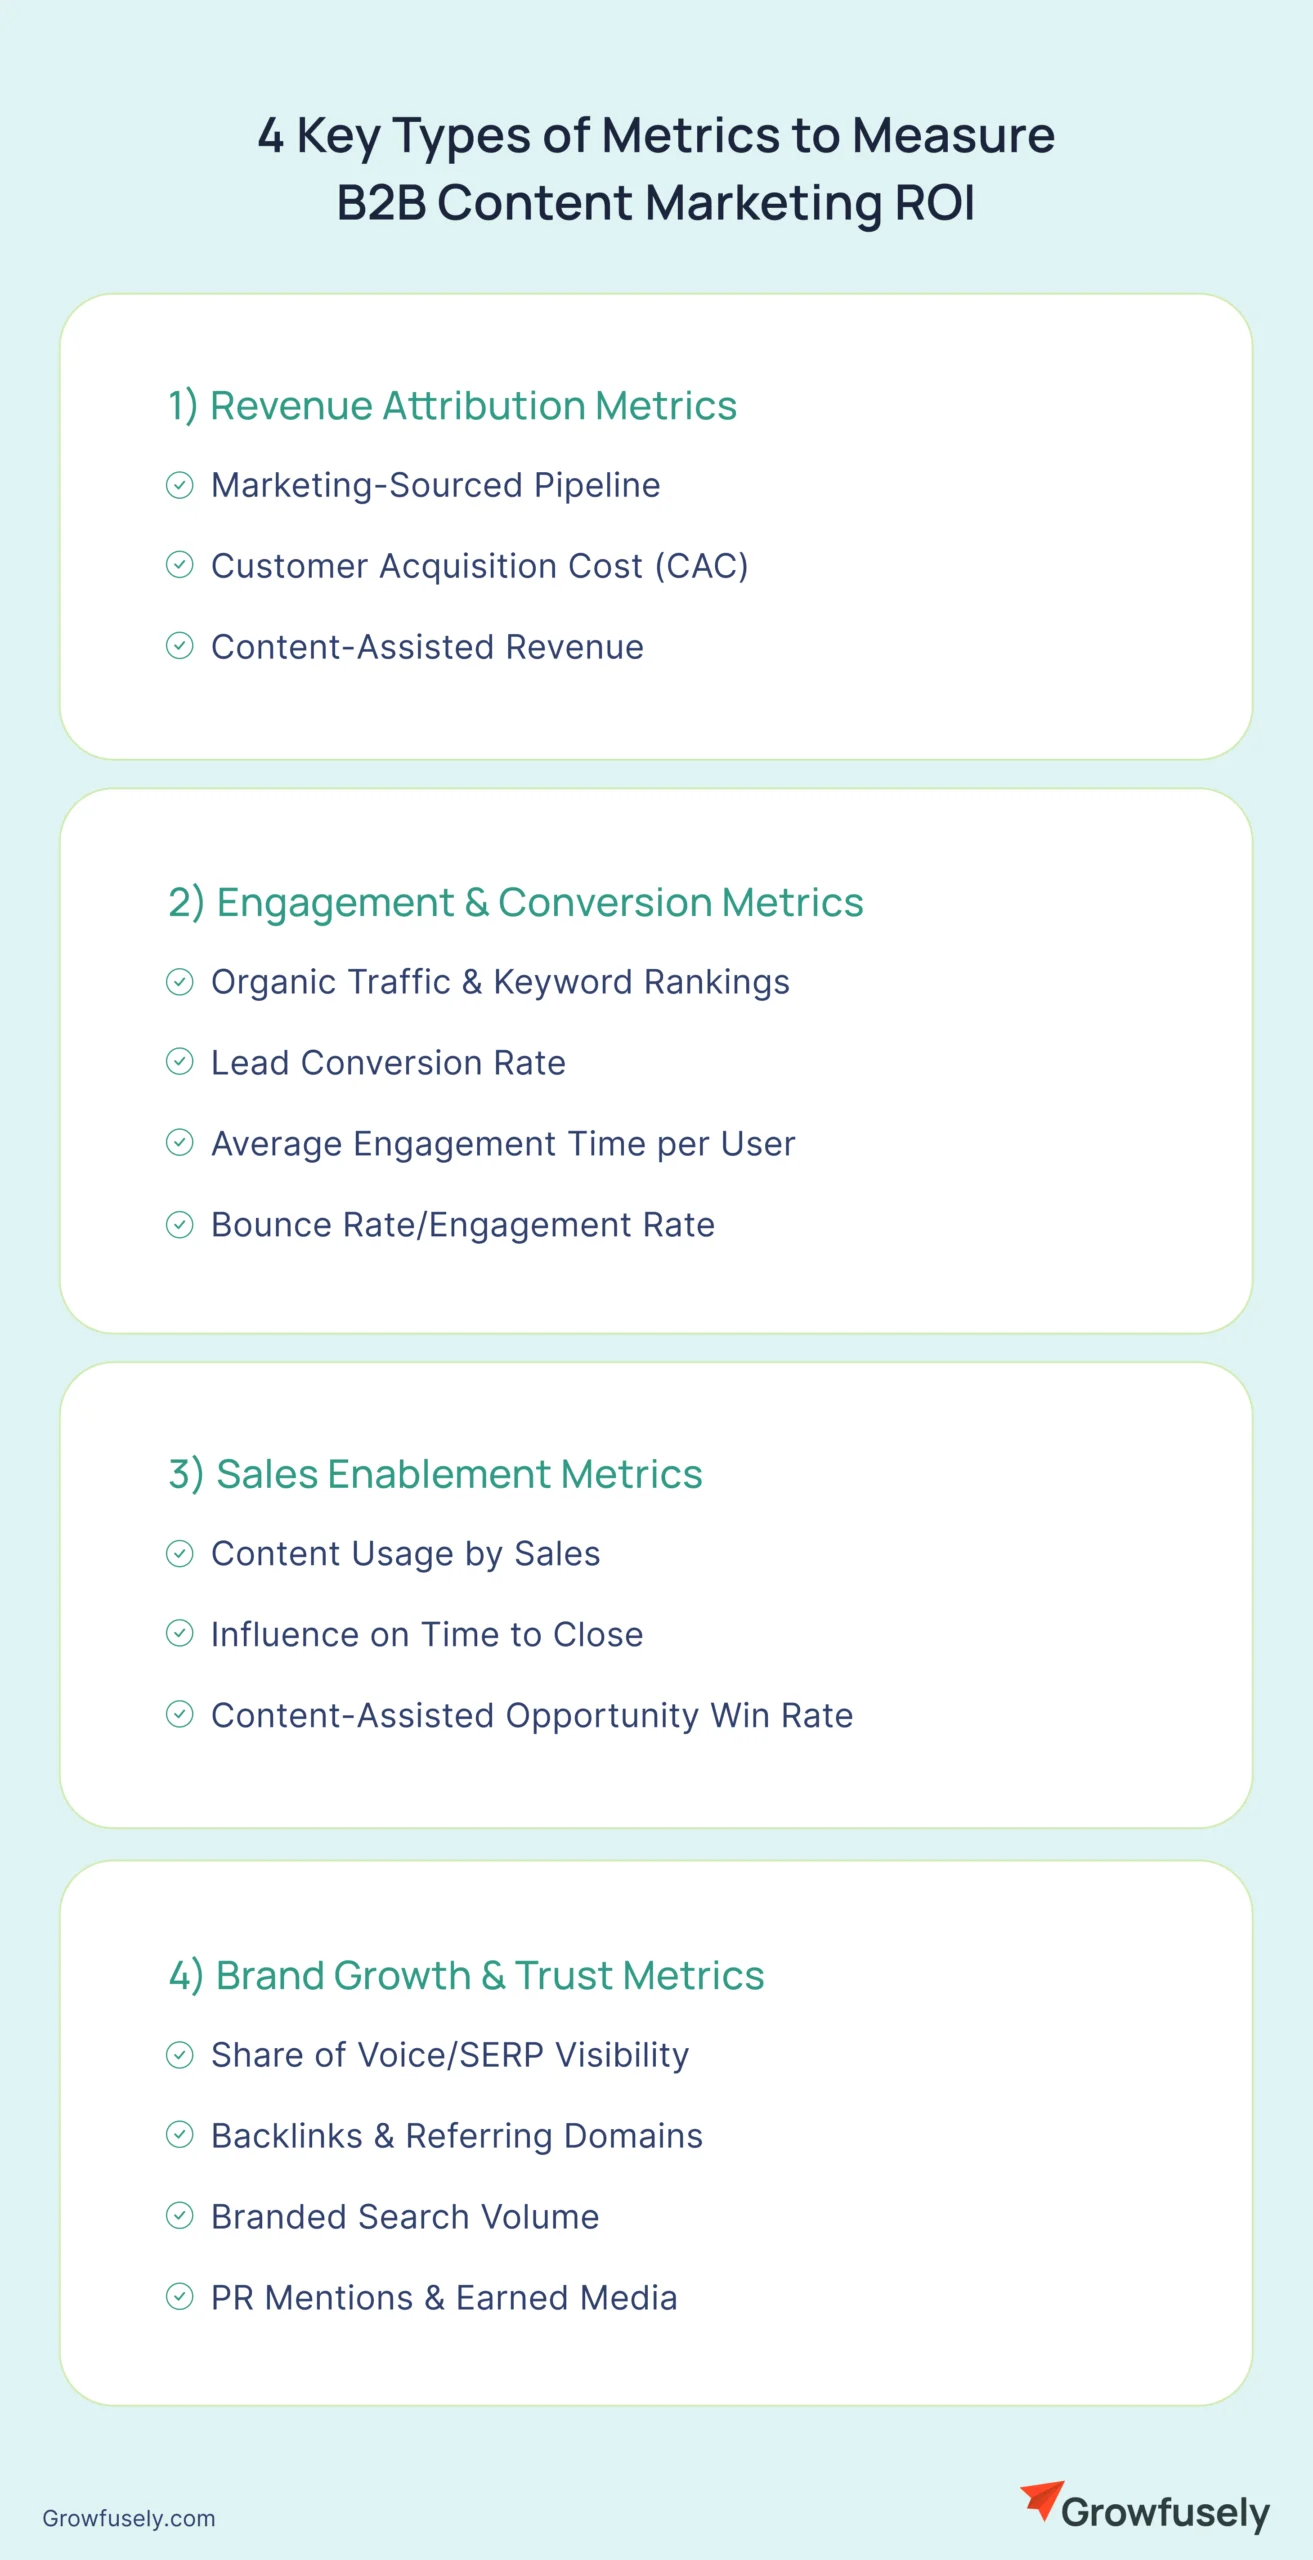
1. Revenue Attribution Metrics
These metrics tie content efforts to pipeline and revenue.
1. Marketing-Sourced Pipeline
This tracks how much of your sales pipeline was created directly from content-driven leads.
If you’re using HubSpot Pro or Enterprise:
Go to Settings → Properties.
Search for “Original Source” and “Lifecycle Stage.”
Make sure these are active on all contact and deal records.
Go to Marketing → Campaigns → Create Campaign.
Associate all related emails, blog posts, landing pages, CTAs, and forms with the campaign.
Use UTM-tagged URLs when promoting content. Example:
This integration lets you see landing page traffic alongside keyword data.
Step 2: Track Organic Landing Pages in GA4
Go to Reports → Engagement → Landing Page.
Add a secondary dimension: Session Source/Medium.
Filter: Source = “google” AND Medium = “organic.”
This shows which blog posts/pages bring the most organic sessions.
Step 3: Track Keywords in Google Search Console
Open Search Console → Performance → Search Results.
Filter by Page to view keyword impressions and clicks for specific blog posts.
Export data to Google Sheets for tracking keyword growth monthly.
Step 4: Monitor Rankings with SEO Tools (Optional)
Use SEMrush or Ahrefs to track exact keyword positions and competitor gaps.
Create position tracking projects to watch your target keywords daily/weekly.
2. Lead Conversion Rate
This shows the percentage of visitors turning into leads (form fills, demos, downloads). In GA4:
Step 1: Define Conversions
In GA4: Admin → Events → Create Event.
Example: Create an event for /thank-you pages after a form submission.
Mark this event as a Conversion.
Step 2: Add Form Tracking (if not using thank-you pages)
Use Google Tag Manager (GTM).
Create a Trigger → Form Submission → Choose all forms or a specific form ID.
Send data to GA4 as an Event (e.g., event_name = “form_submit”).
Mark it as a Conversion in GA4.
Step 3: Build a Conversion Funnel Report
In GA4: Explore → Funnel Exploration.
This is where you can see drop-offs and actual conversion rates.
Step 4: Calculate Conversion Rate
Conversion Rate = Total Conversions ÷ Total Visitors × 100.
GA4 automatically shows this if you add “Conversions/Sessions” as a metric.
3. Engagement Time
Are visitors even reading your content? This is GA4’s replacement for metrics like “time on page.”
In GA4:
Step 1: Open Reports → Engagement → Pages and Screens.
Look at the “Average engagement time per user” for blog posts.
Compare across posts to spot which ones hold attention best.
Step 2: Segment by Traffic Source
Add a secondary dimension: Session Source/Medium.
See if organic visitors spend more time compared to social or email.
Step 3: Identify Content Drop-Offs
Use Explore → Path Exploration.
Select a popular blog post as the starting point.
See where users go next or if they drop out.
This helps you optimize CTAs and internal links.
4. Bounce Rate/Engagement Rate
This shows whether visitors leave without engaging. In GA4:
Step 1: Understand GA4’s Redefinition
GA4 doesn’t use “bounce rate” in the same way as Universal Analytics.
Instead, it tracks Engagement Rate = sessions with 10+ seconds, conversion, or 2+ pageviews.
Step 2: Add Bounce Rate to Reports
In Reports → Engagement → Pages and Screens → Customize Report.
Add “Bounce Rate” back as a metric.
Save the report for easy access.
Step 3: Compare by Content Type
Blog posts often have higher bounce rates (single-page reads).
Landing pages should aim for lower bounce rates by driving conversions.
5. Assisted Conversions
This shows if content contributes indirectly to lead generation. Here’s how to track it in GA4 attribution:
Step 1: Go to Advertising → Attribution → Conversion Paths.
Choose a conversion (e.g., “form_submit”).
Review the touchpoints leading to conversion (Organic → Direct → Email → Conversion).
Step 2: Compare Attribution Models
Change the model from Last-Click to Data-Driven or Linear.
This redistributes credit across multiple touchpoints.
Helps show how early-stage content (like blogs) contributes to revenue.
Step 3: Export Data for Deeper Analysis
Link GA4 to BigQuery.
Build Looker Studio dashboards that map assisted conversions to specific blog posts or campaigns.
By setting up these engagement and conversion metrics correctly, you’ll see not just traffic numbers, but whether your content is driving real leads and influencing revenue.
3. Sales Enablement Metrics
Marketing-sourced pipeline, aka content-assisted opportunity win rate, helped determine: Does content actually help close more deals?
But there are a couple more metrics that show how well your content supports your sales team.
1. Content Usage by Sales
This measures how often your sales reps actually use the content you create—case studies, one-pagers, decks, whitepapers—when talking to prospects.
Here’s how to track this in HubSpot:
Step 1: Upload and Share Content via HubSpot Documents
Go to Sales → Documents → Upload.
Store assets like PDFs, decks, and one-pagers here instead of emailing them as attachments.
This enables link-based sharing (with tracking).
Step 2: Train Reps to Use Tracked Links
When sending follow-up emails, reps should insert the HubSpot link, not the raw PDF.
HubSpot automatically logs views and shares to the CRM record.
Step 3: Track Content Performance
Go to Sales → Documents → Reports.
Metrics you’ll see:
Number of times each document was used by reps
Total views by prospects
Time spent on each page of the doc
Step 4: Tie Back to Deals
Open any deal record.
Check the “Documents Viewed” section to see if the prospect engaged with a sales asset.
This proves which content actually moves deals forward.
2. Influence on Time to Close
If sales content is effective, deals should close faster when it’s used.
Here’s how to track this in HubSpot:
Step 1: Use Playbooks or Tracked Documents
When reps use a HubSpot playbook or document, it logs automatically in the deal timeline.
Step 2: Build a Custom Report
Reports → Custom Report Builder.
Choose Deals + Activities.
Filter by “Documents Viewed = True.”
Add metrics: Average Time in Deal Stage, Average Days to Close.
Step 3: Visualize Impact
Compare deals with content vs. deals without.
Use bar or line charts to show time-to-close differences.
To really nail this, standardize naming conventions for content campaigns (e.g., “CaseStudy_Healthcare_2025”) and enforce UTM tagging + CRM integration. This ensures every time sales uses content, it leaves a data trail you can report on.
By setting these up, you’ll be able to walk into any CMO or CRO meeting and prove: “Deals where sales used our content closed 23% faster and had a 15% higher win rate.”
For all brand/trust metrics, don’t present them in isolation. Always frame them like:
“Backlinks from 10 new referring domains → +15% increase in organic traffic → +40 MQLs from organic in 3 months.” This connects brand growth → visibility → pipeline, making it real ROI.
Typically, What is the ROI of B2B Content Marketing?
As humans, it’s in our nature to compare our work and its output with others. So, a fair question you might ask: What does “good” B2B content marketing ROI look like?
To hit the ground running, it’s helpful to see where the bar stands. Here’s what recent data tells us:
1. Overall Content Marketing ROI
A 5:1 ROI (meaning five dollars gained for every dollar spent) is considered strong in B2B marketing. A ratio below 2:1 (200%) may signal underperformance.
FirstPageSage’s analysis of B2B campaigns (2016-2021) found an average ROI of 748%, with a 3-year average reaching 844%, especially in biotech and life sciences, generating about $1.1 million in new revenue.
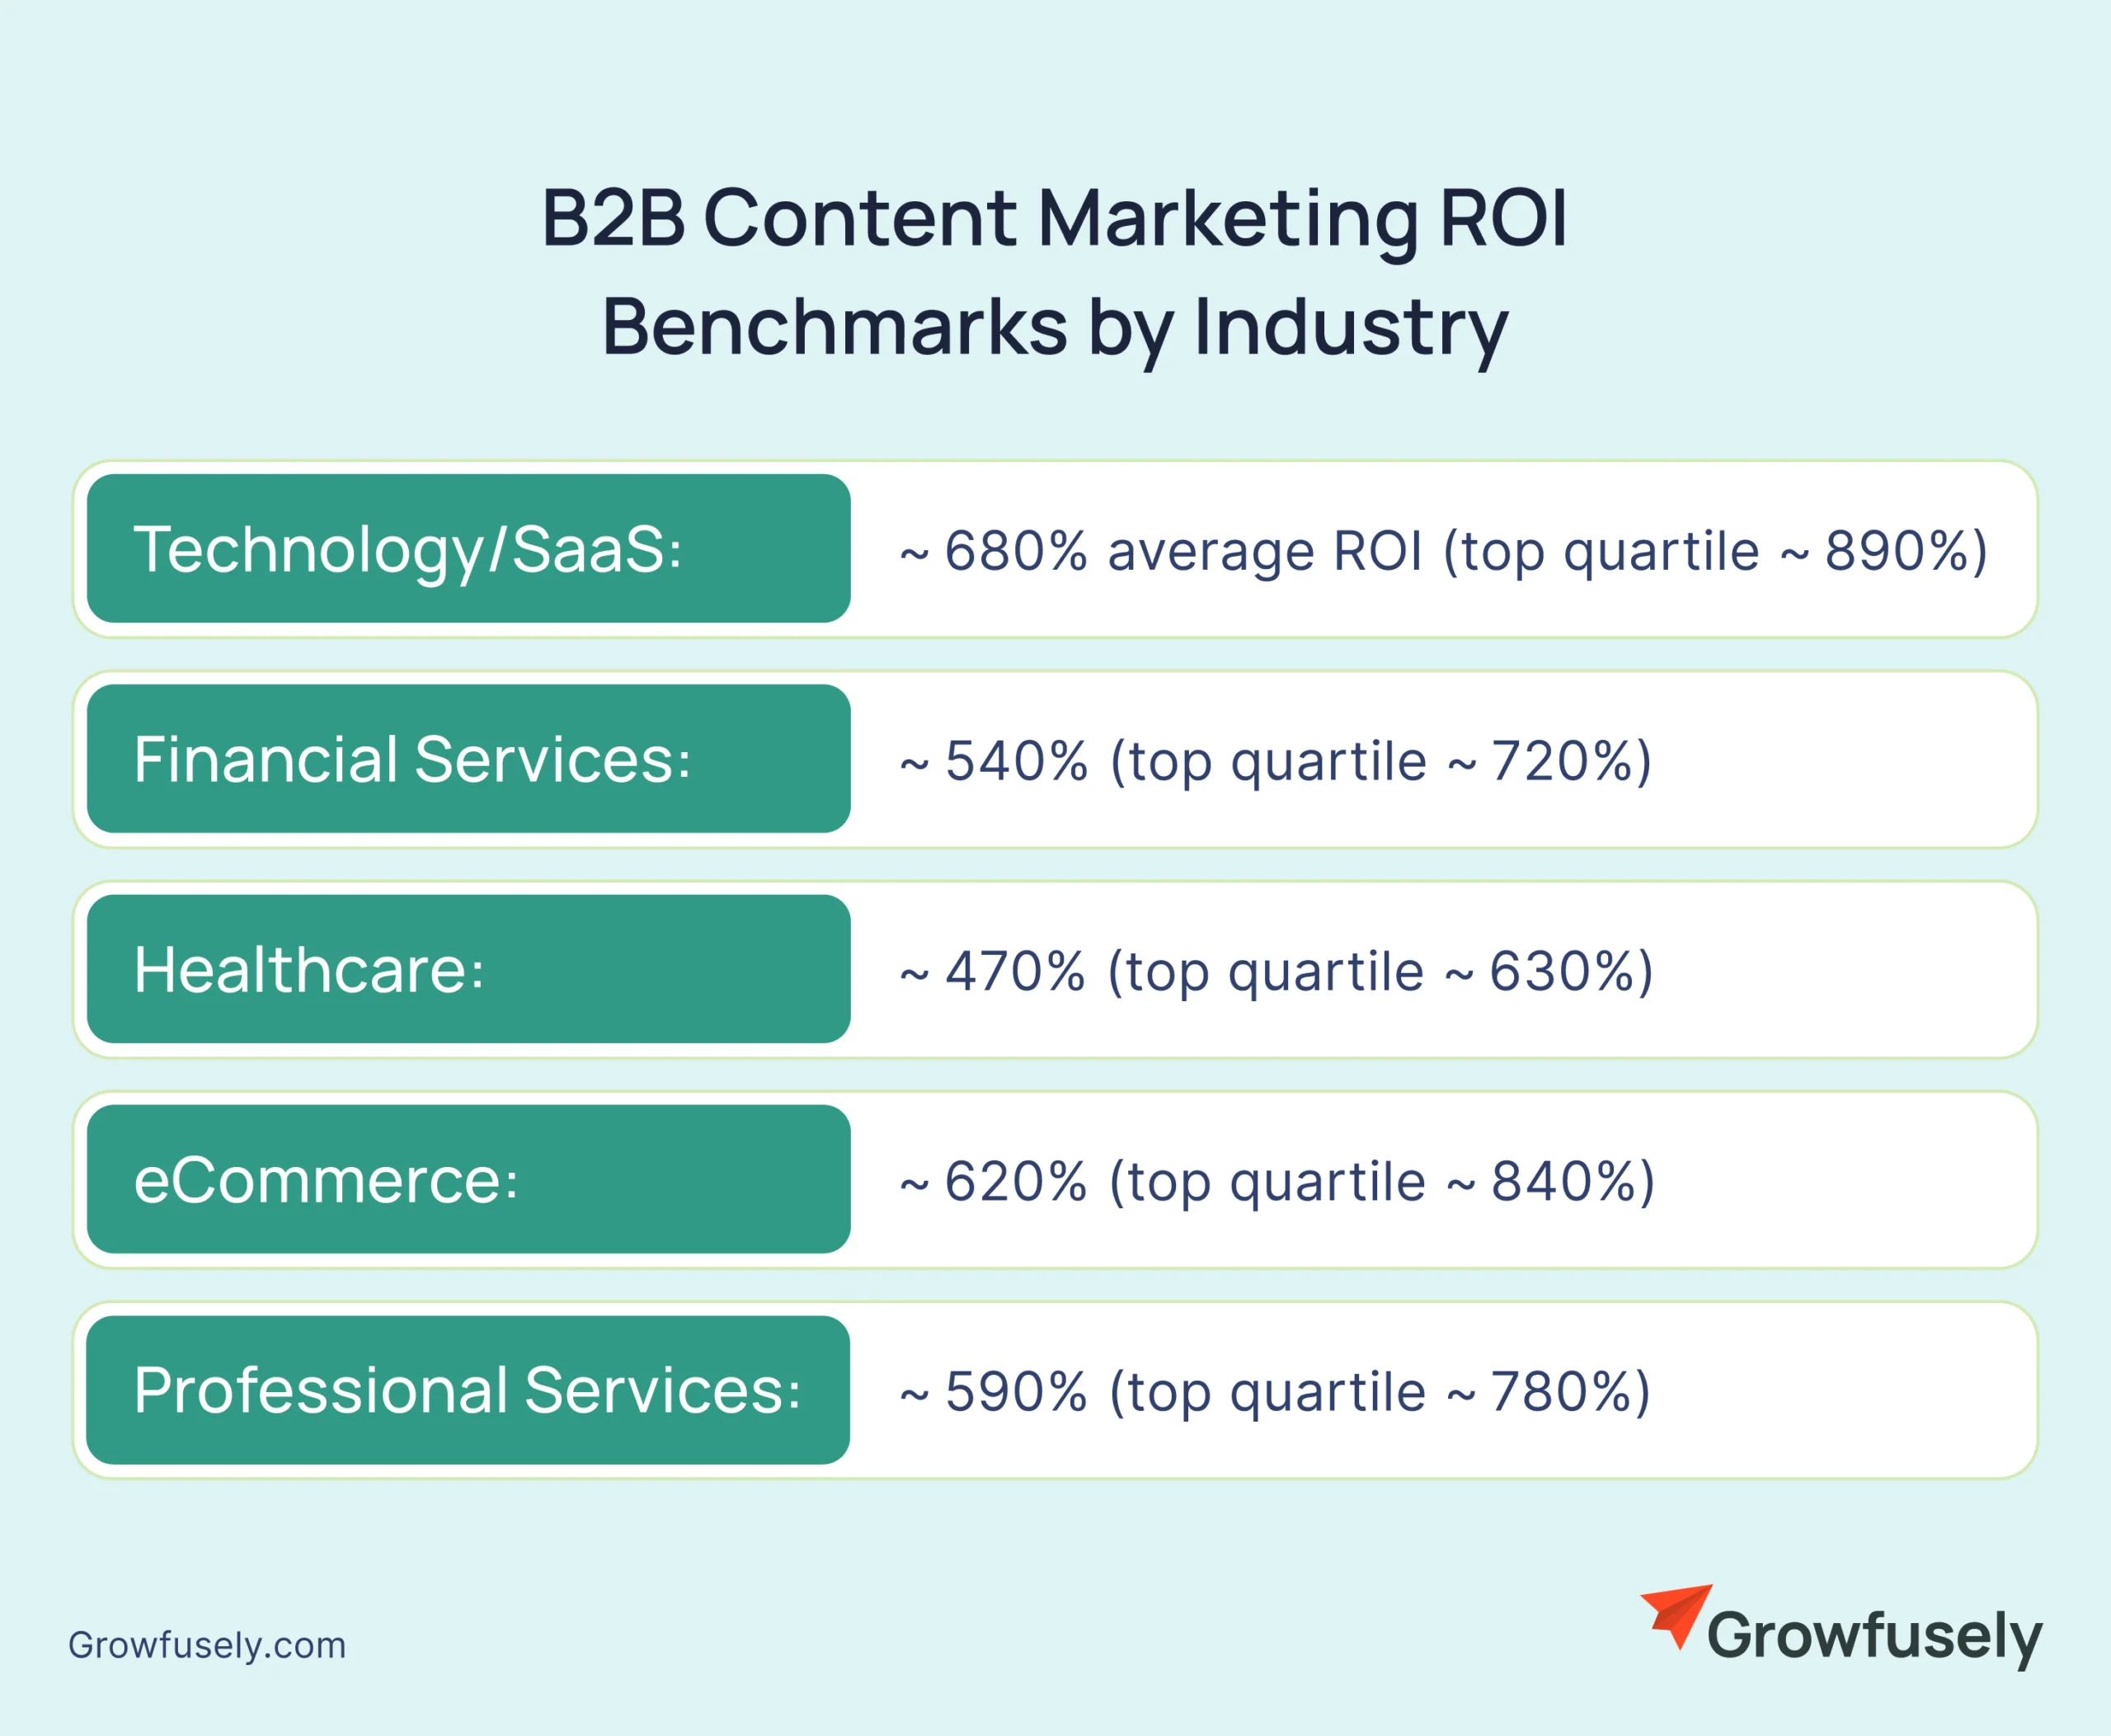
2. ROI by Industry
From a 2025 benchmark breakdown:
Technology/SaaS: ~ 680% average ROI (top quartile ~ 890%)
Financial Services: ~ 540% (top quartile ~ 720%)
Healthcare: ~ 470% (top quartile ~ 630%)
eCommerce: ~ 620% (top quartile ~ 840%)
Professional Services: ~ 590% (top quartile ~ 780%)
3. SEO-Specific ROI
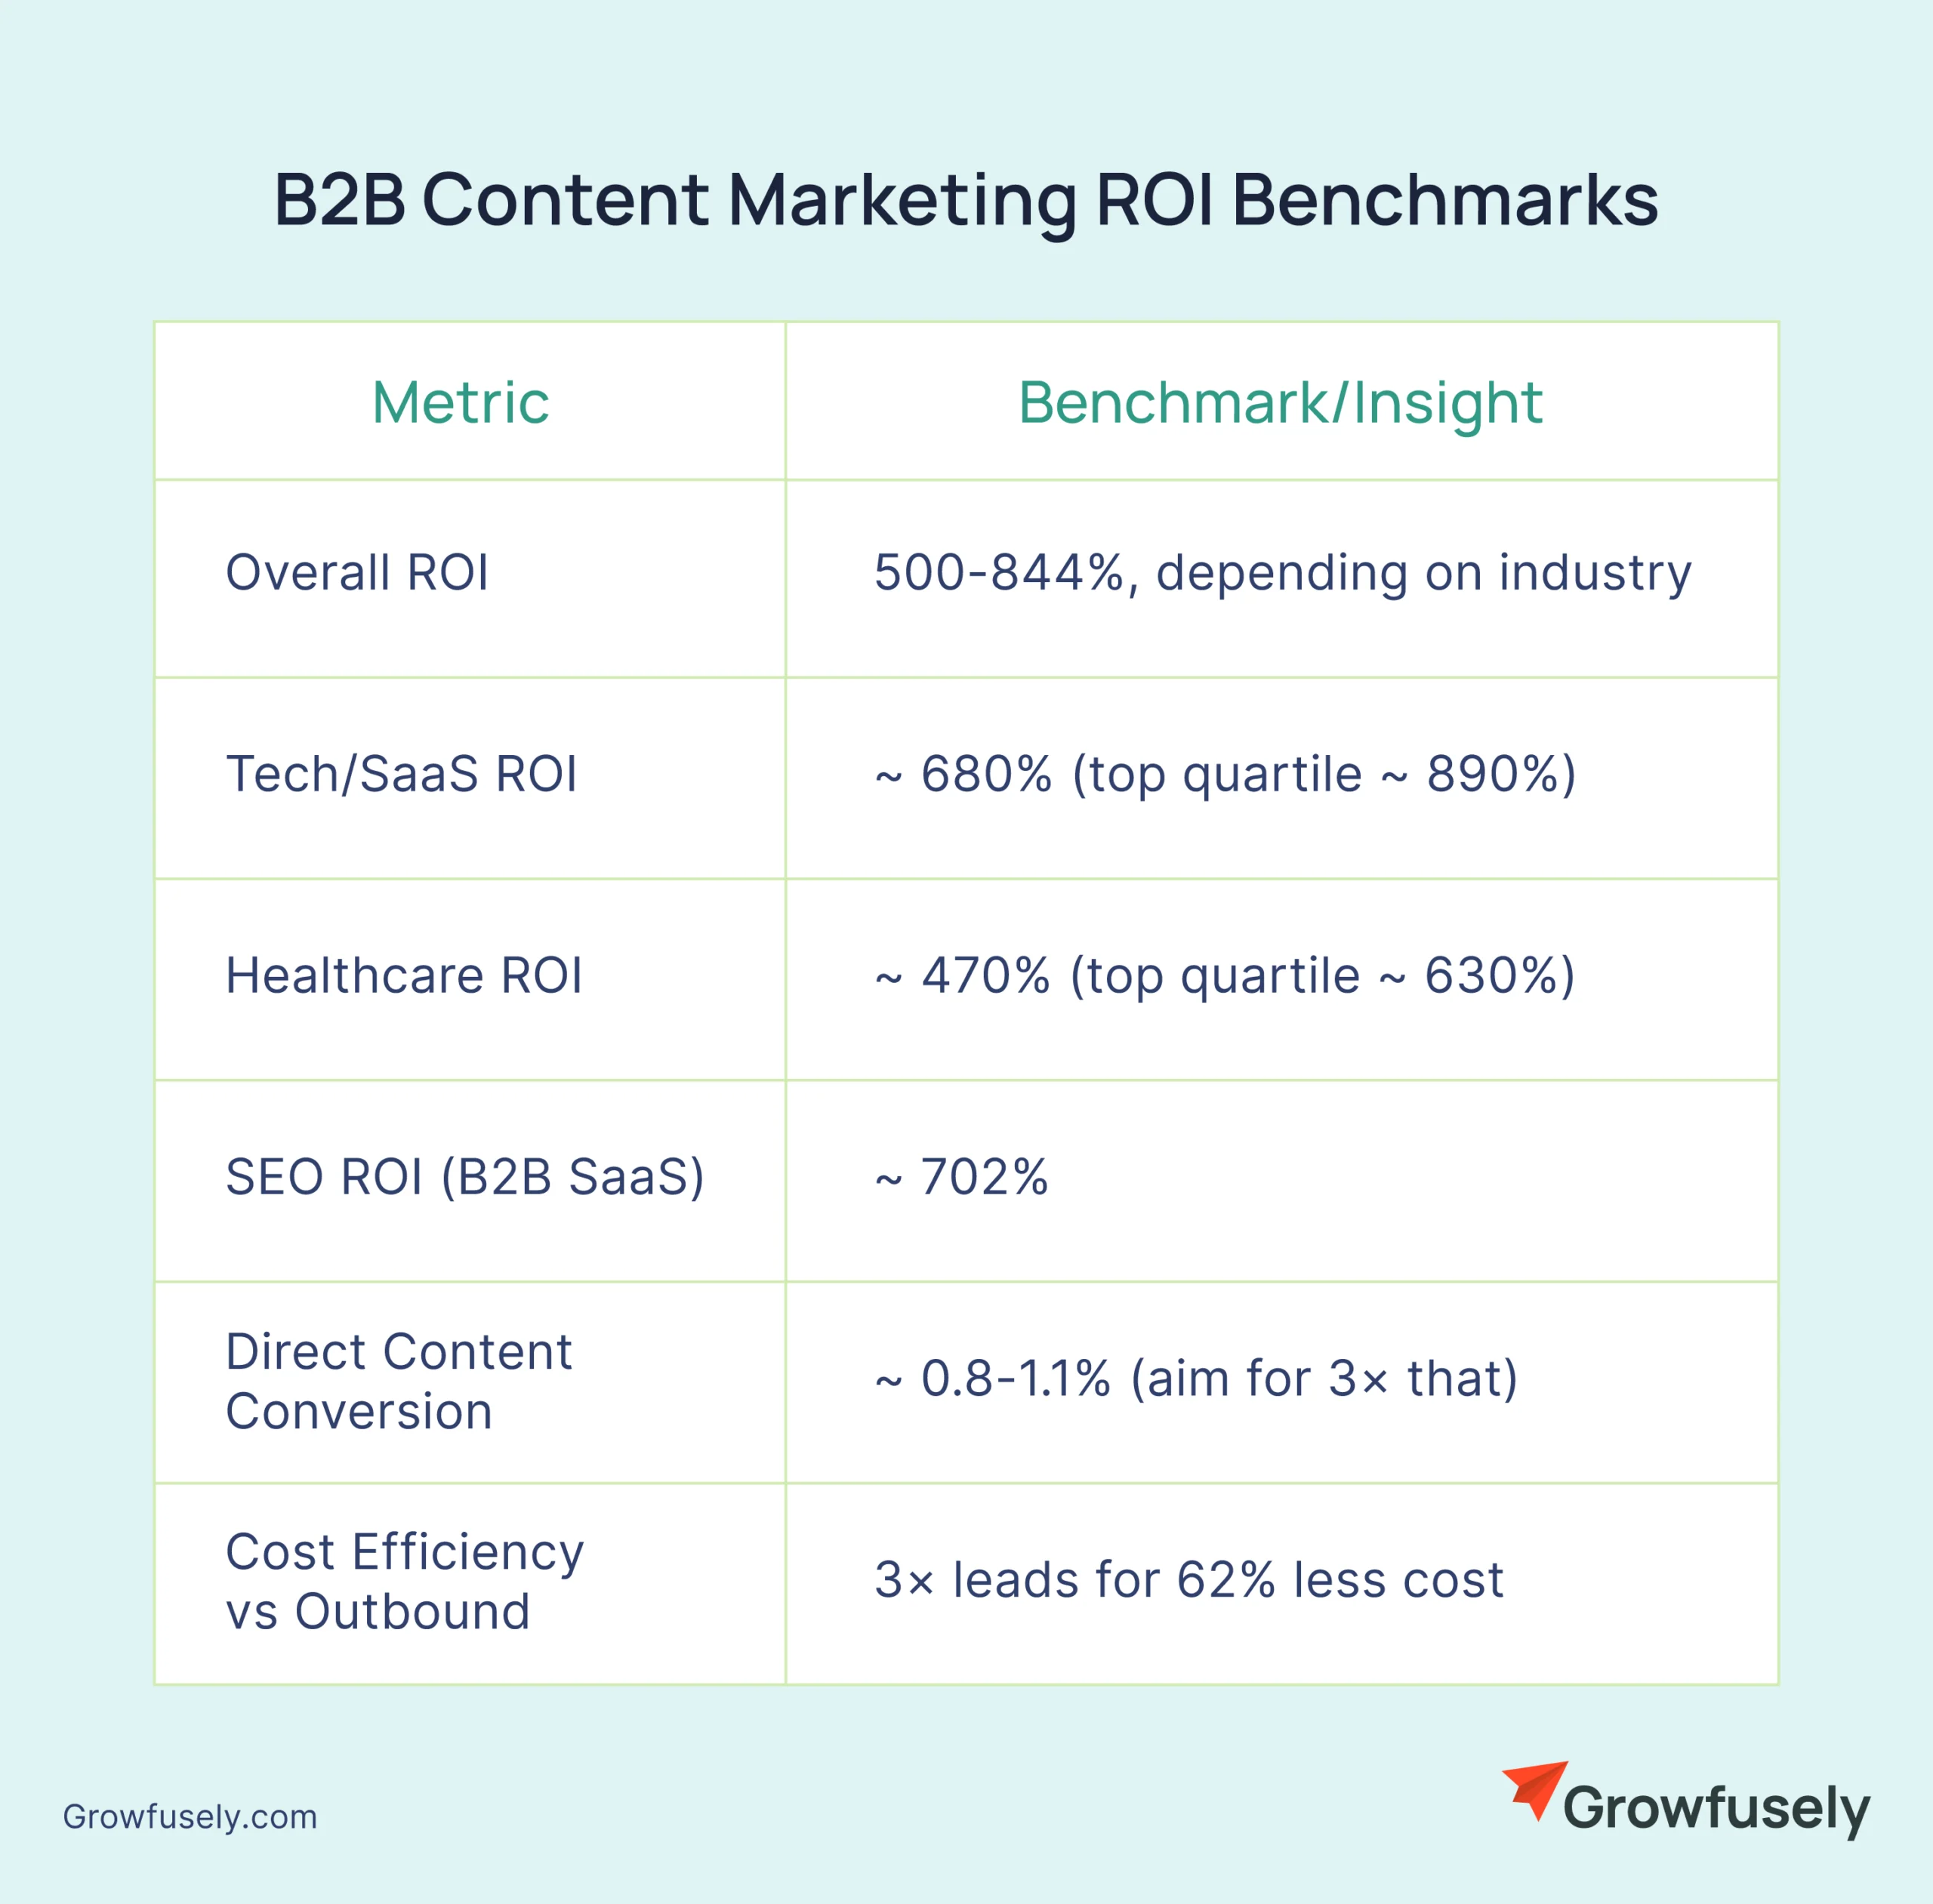
Focusing on organic search payoffs, B2B SaaS businesses see an average 702% ROI from SEO efforts.
4. Lead Conversion Benchmarks
Average direct lead conversion rate on B2B content ranges between 0.8% and 1.1%, and a smart target is to aim for at least three times that rate.
5. Content’s Lead Volume Efficiency
Content marketing generates 3X more leads and costs 62% less than outbound marketing.
Here’s a quick summary table of all these numbers.
So, what does it mean for you? Well:
Set realistic targets. If you’re in tech, aiming for ~ 600-700% ROI is ambitious but valid.
Track conversion benchmarks. If you’re under 1% conversion, there’s room to experiment and improve.
Use SEO for compounded returns. It’s majorly efficient in B2B SaaS.
Compare against your industry. Healthcare, for example, can expect somewhat lower, but still strong, returns.
Highlight efficiency in reports. Showing that content delivers more (leads) for less (cost) is a slick argument to stakeholders.
How to Calculate B2B Content Marketing ROI (Step by Step)
As mentioned earlier, the formula is simple on paper:
ROI = (Return – Investment) ÷ Investment × 100
But in B2B content marketing, the devil’s in the details. You need to define what counts as return (pipeline, closed revenue, influenced revenue) and what counts as investment (salaries, tools, production, distribution).
Here’s how to break it down in practice.
1. Define Your Investment
Include all costs tied to content:
Team salaries (content writers, designers, SEO specialists, etc.)
If using a marketing ops tool (e.g., HubSpot or Marketo), assign costs to campaigns directly.
2. Define Your Return
In B2B, return can be calculated in a few ways depending on company maturity and reporting capability:
Marketing Qualified Leads (MQLs): Value based on historical close rate × average deal size.
Pipeline Created: The total value of opportunities attributed to content.
Closed-Won Revenue: Most accurate, but requires proper attribution setup.
For this:
In Salesforce or HubSpot, pull “Deals by Source” or “Opportunities by Campaign.”
Use multi-touch attribution to give credit to early-funnel content (blog posts, reports) as well as bottom-funnel assets.
3. Apply the Formula
Consider an example:
Investment: $20,000 in content spend this quarter.
Return: $100,000 in pipeline influenced by content (from CRM reports).
ROI = ($100,000 – $20,000) ÷ $20,000 × 100 = 400%
That means every $1 spent on content delivered $4 in pipeline.
4. Automate Reporting
Instead of calculating ROI manually every quarter, set up dashboards.
In HubSpot:
Use Campaign Analytics → Assign all content assets to a campaign.
Pull reports on influenced deals and revenue.
Add a custom calculation field for ROI.
In Salesforce:
Use Campaign Influence Attribution reports.
Track Closed-Won revenue influenced by content campaigns.
Export to Tableau/Looker Studio for visualization.
In Google Looker Studio (free option):
Connect GA4 + CRM data (HubSpot, Salesforce, or Google Sheets).
Build a custom metric:
ROI = (Revenue – Cost) / Cost
Display ROI trends over time by campaign or channel.
5. Expect Delays in Payback
Unlike paid ads, content ROI compounds.
SEO blogs may take 3-6 months to show up in ROI reports.
Case studies and whitepapers may influence deals quietly until sales logs it.
Don’t panic if ROI looks low in the first quarter—track trends over 12 months.
With this setup, you’ll know your ROI and be able to show where it comes from—SEO, whitepapers, webinars, or case studies.
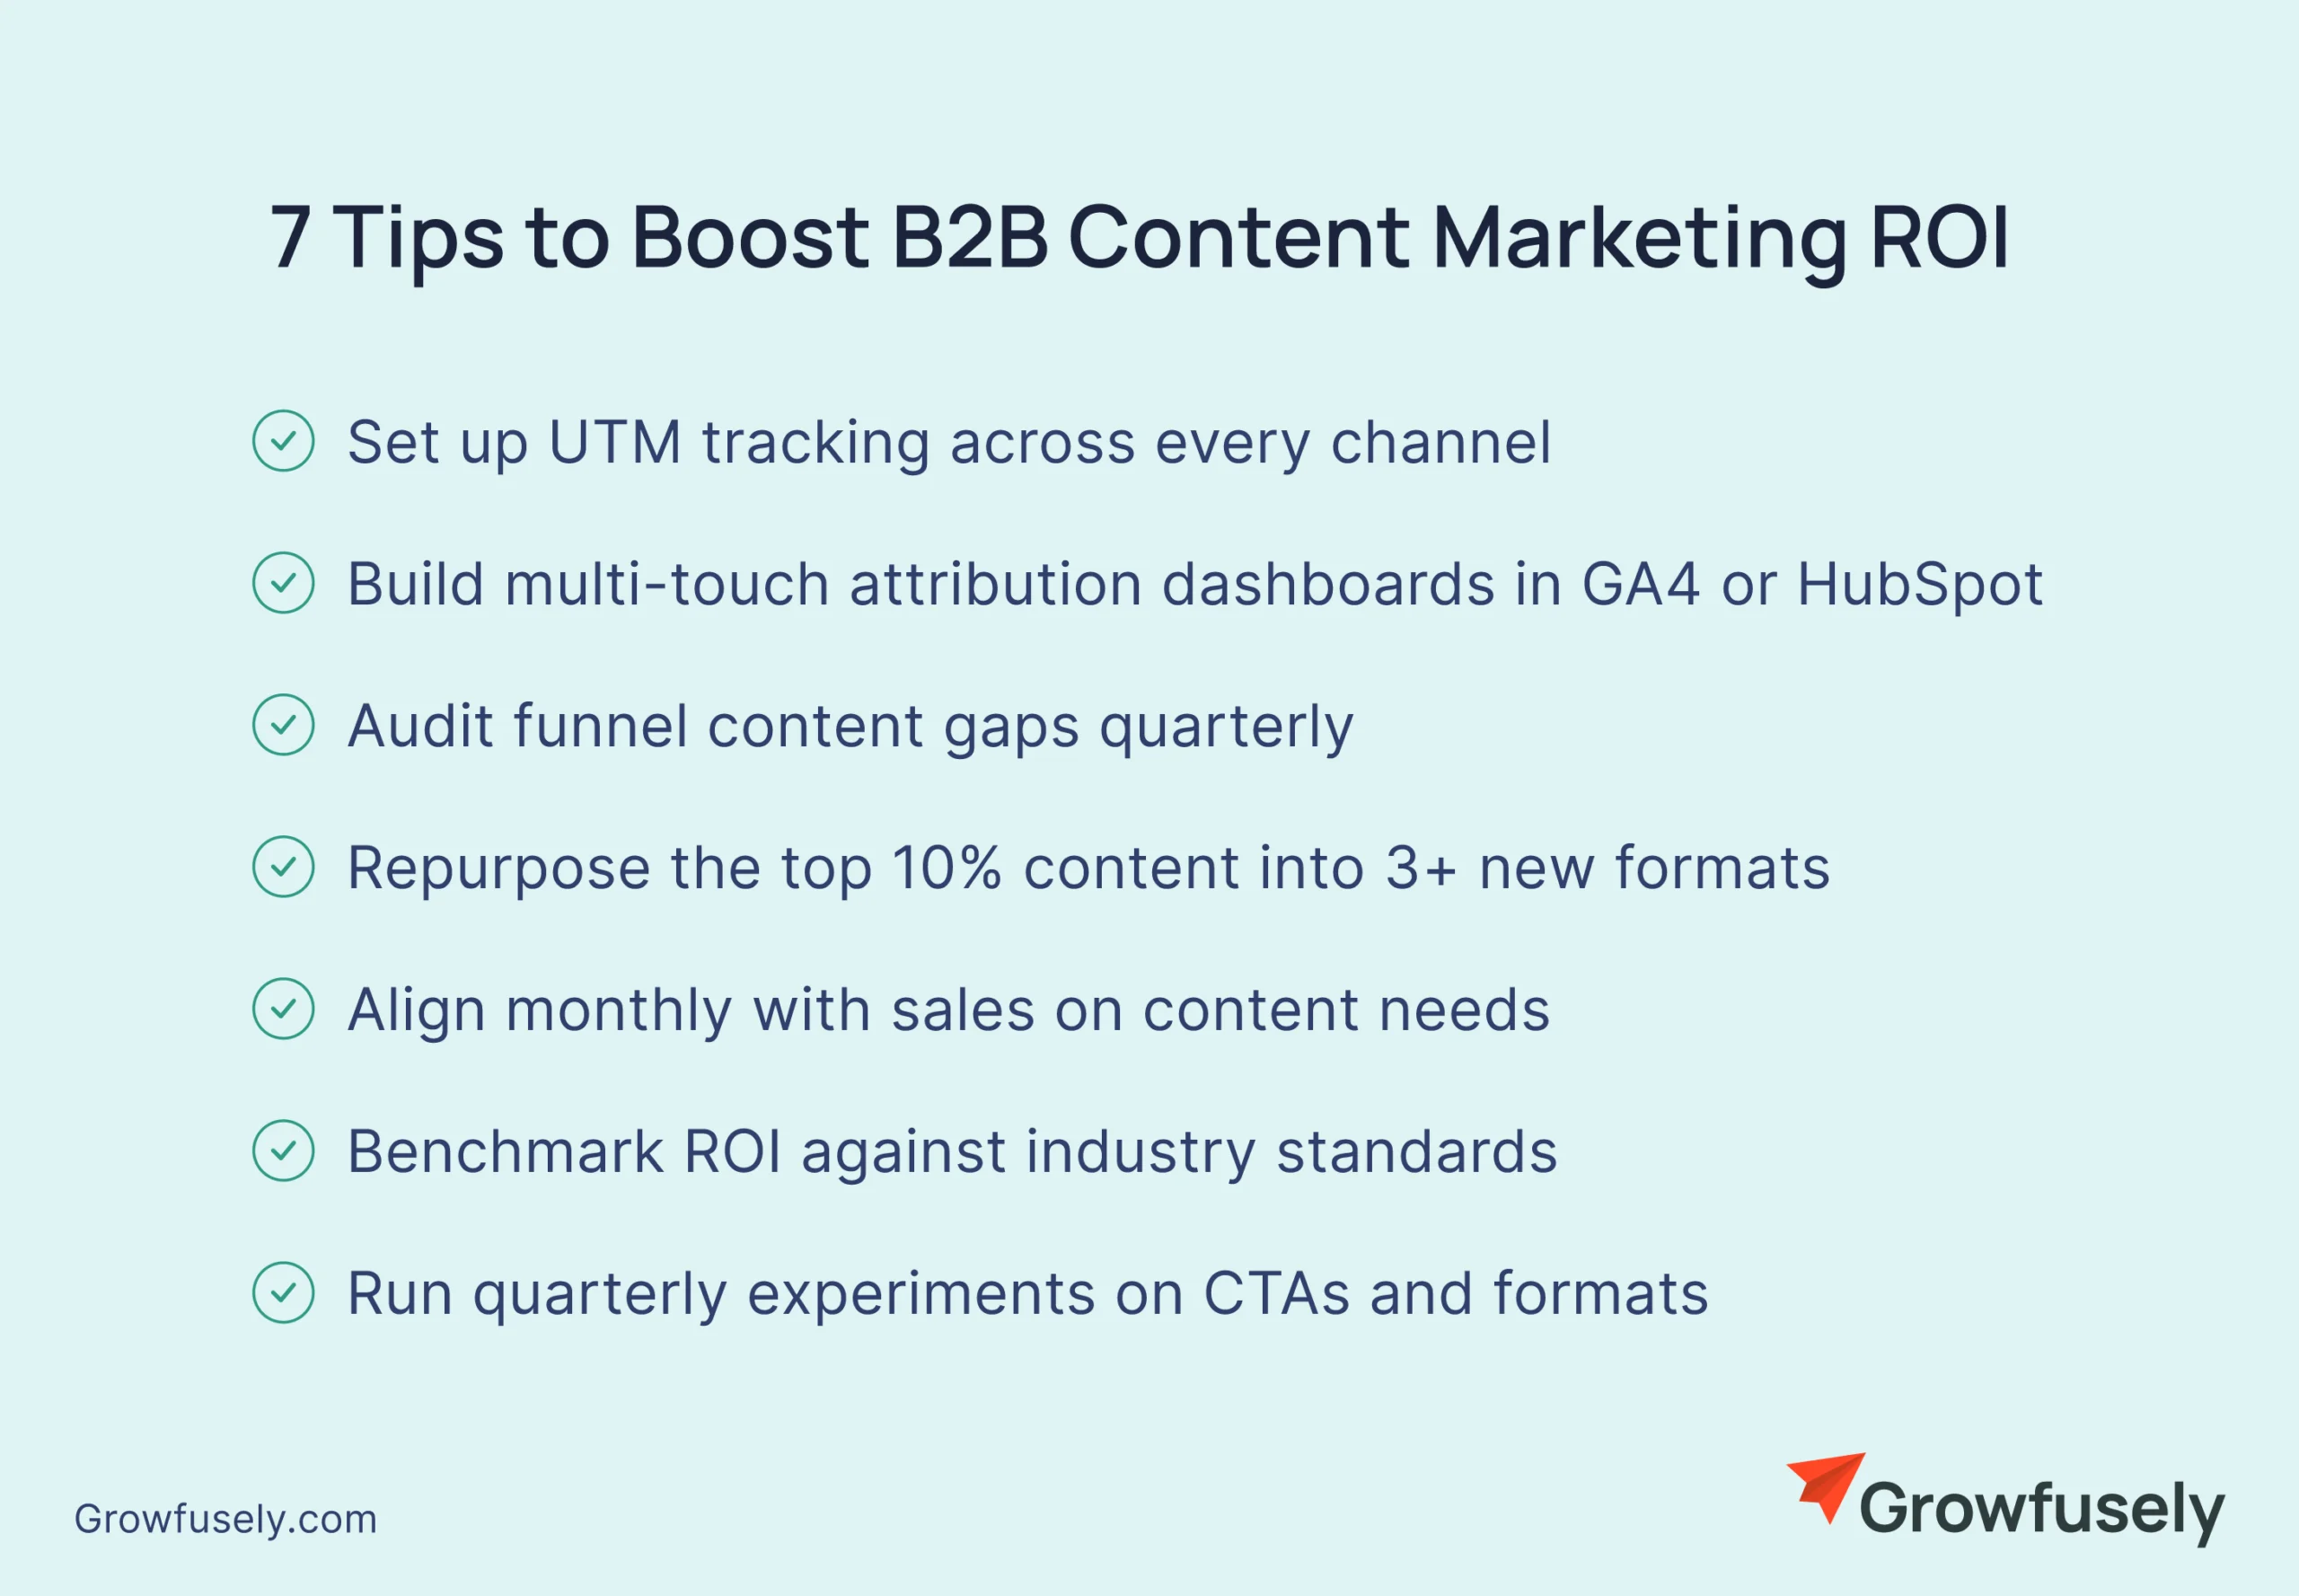
7 Proven Growth Tips to Improve B2B Content Marketing ROI
Get the most out of your content marketing efforts with these seven tried and tested tactics.
1. Double Down on Bottom-Funnel Content
Top-of-funnel blogs are great for awareness. But in B2B, the real ROI often comes from content that helps close deals. Think case studies, ROI calculators, and comparison pages.
So:
Audit your funnel. Which sales objections come up repeatedly?
Create content that addresses them (e.g., “vs competitor” pages, detailed case studies).
Enable sales. Upload assets to HubSpot/Salesforce or Highspot so reps can track usage.
2. Map Content to the Buyer Journey
Content ROI gets lost when you spray and pray. Instead, map content to Awareness → Consideration → Decision stages.
Build a content matrix with personas vs. funnel stages. For example:
Awareness: Thought-leadership blog posts, research reports.
In HubSpot/Marketo, assign each content asset to a lifecycle stage for attribution reporting.
3. Repurpose Top-Performing Assets
Why reinvent the wheel? A strong whitepaper can fuel a dozen blog posts, LinkedIn posts, and email drips.
Use GA4 + Search Console to identify the top 10% content by engagement and conversions. Then, repurpose into LinkedIn carousels, Short videos, and sales collateral. Finally, track performance uplift in HubSpot campaigns by tagging all repurposed formats.
4. Use Lead Scoring to Focus on High-ROI Leads
Not every lead is equal. You’ll burn ROI if you chase the wrong ones. In HubSpot or Salesforce Pardot:
Assign scores to key actions (e.g., +20 for demo request, +10 for whitepaper download, +5 for webinar attendance).
Subtract points for irrelevant behavior (e.g., unsubscribes).
Route only “sales-ready” leads to SDRs.
Track conversion % from MQL → SQL → Closed Won.
5. Invest in SEO for Compounding Returns
Paid ads stop when budgets stop. SEO can be your gift that keeps on giving long after the investment (yes, even in the age of AI!).
Run a content audit with Ahrefs/Semrush. Optimize high-potential pages (keywords ranking #11–20). Build internal links from high-traffic blogs to new pages.
Measure ROI using GA4 attribution → Organic conversions → Assisted conversions.
6. Align Content With Sales Enablement
The best ROI happens when marketing and sales pull in the same direction.
For this to happen:
Meet with sales monthly to ask what content prospects are asking for.
Create assets specifically for their objections.
Train reps on how to use and track them (e.g., HubSpot Documents).
Compare deal velocity in Salesforce between deals with content used vs. not used.
7. Test, Optimize, Repeat
ROI isn’t static. It improves through iteration.
Here’s how to iterate:
In GA4, set up A/B testing via Google Optimize or Optimizely (CTA buttons, headlines, form layouts).
Track performance in GA4, such as event conversions, engagement time, and assisted conversions.
Retire underperforming content. Double down on formats and CTAs that deliver.
Done right, these steps can compound your metrics. One strong case study doesn’t just help marketing—it arms sales, boosts SEO, fuels LinkedIn, and nudges ROI upward across the board.
Wrapping Up
Measuring ROI in B2B content marketing isn’t easy by any means. There’s (usually) never a straight line from blog post to closed deal. But with the right setup—UTMs, GA4, CRM integration—you can connect the dots.
The key takeaway is simple: ROI tracking should focus on building compounding returns. Content that keeps working months or years after you publish it.
If you track the right metrics, benchmark realistically, and keep optimizing, you’ll not only prove content’s worth, you’ll grow its impact quarter after quarter.
Use the formula: (Return – Investment) ÷ Investment × 100.
Here, return means pipeline created, closed-won revenue, or influenced deals. And investment includes everything from salaries and tools to promotion and production costs. Set up GA4 with UTM tags, track conversions, and connect it with your CRM (HubSpot, Salesforce) for revenue attribution.
2. What is a good ROI for B2B content marketing?
Benchmarks vary by industry, but a 5:1 return (500%) is considered strong. SaaS and tech firms often see 600-800% ROI from content, while industries like healthcare average around 400-600%.
3. What are the best metrics to track B2B content marketing ROI?
Focus on metrics tied to revenue, not vanity stats. This includes marketing-sourced pipeline, closed-won revenue influenced by content, conversion rates (MQL → SQL → Closed), engagement time (proof of quality), and assisted conversions (multi-touch attribution).
4. How long does it take to see ROI from content marketing?
Typically 3-6 months for SEO-driven content, longer (6-12 months) for complex B2B funnels. Early signs often show up as assisted conversions before direct revenue.
5. What’s the difference between ROI and ROAS?
ROI (Return on Investment) measures the overall profitability of all spend. ROAS (Return on Ad Spend) measures revenue generated specifically from ad campaigns. ROI is broader and more strategic.
6. Which metrics are most important for B2B content ROI?
Focus on: pipeline created, closed-won revenue influenced by content, lead conversion rates, and engagement time. Vanity metrics like pageviews matter less unless tied to conversions.
7. Is SEO still worth the investment for B2B?
Absolutely. SEO-driven content compounds over time. Data shows SaaS companies see ~700% ROI from SEO. Unlike paid campaigns, organic traffic keeps generating returns without constant spend.
8. How do I prove ROI to executives who only care about revenue?
Tie content directly to deals. Show influenced pipeline from CRM reports. Compare deal velocity and win rates with vs. without content. Use attribution models (data-driven in GA4 or Salesforce Campaign Influence) to connect content to revenue.

 About Growfusely
 White LabelMake us your (hidden) helping hand in delivering high-quality work to your SaaS clients.
 TeamCheck out the faces (and their backstories) behind our brand.
 Partner With UsJoin forces with us and earn a recurring monthly commission.
 Careers We're HiringJoin our growing team of passionate content marketing geeks.
 SEOBoost your search engine rankings with a blend of compelling content and technical tweaks.
 Content MarketingFuel your brand awareness and user acquisition with strategic content creation and distribution.
 Link BuildingEarn relevant, high-quality backlinks from top websites in and around your niche.
 Content WritingGet consistent, high-quality content that’s loved by users and search engines alike.
 Creative ServicesLeverage our seasoned designers to create custom-branded lead magnets, landing pages, infographics, and more.
 Digital PRSecure strong brand mentions and links on high-authority niche publications.
 SaaS InfographicsLearn battle-tested best practices on all things SaaS marketing — visually.
 SaaS InterviewsRead our tête-à-têtes with SaaS marketing experts on achieving content-driven organic growth.